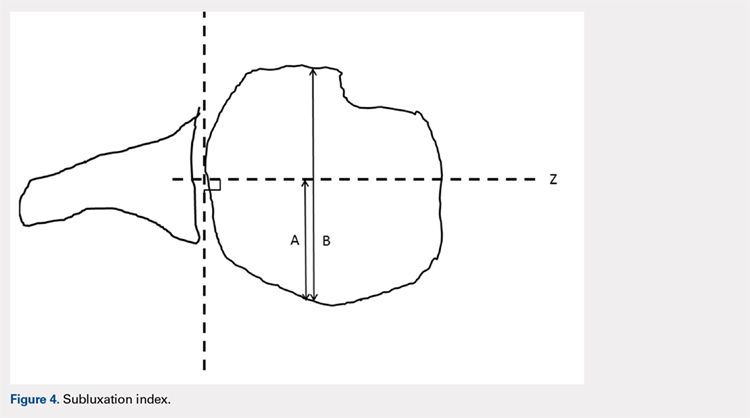
Posterior subluxation is indicated by a value >65%, a centered head is between 35% and 65%, and anterior subluxation is indicated by a value <35% (Figure 4).3
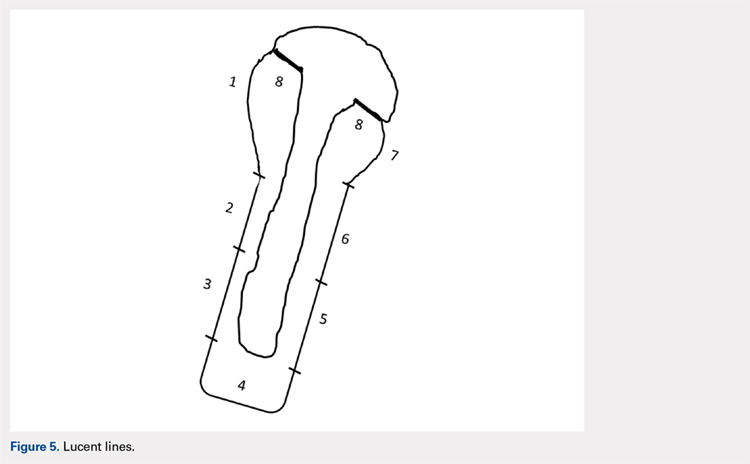
The humeral stems were evaluated for loosening by assessing for lucency on final radiographic follow-up films. These were evaluated in a zonal fashion as demonstrated by Sanchez-Sotelo and colleagues4 and in Figure 5.
FUNCTIONAL OUTCOME EVALUATION
Before clinical evaluation, each study patient completed the Western Ontario Osteoarthritis of the Shoulder (WOOS) index; the Disabilities of the Hand, Arm and Shoulder (DASH) questionnaire, and the pain and function sections of the Constant score. The functional outcomes scores were captured postoperatively from October to November 2011. The WOOS is a validated outcome measure specific to osteoarthritis of the shoulder and has been used in prior studies evaluating outcomes of TSA.5-7 Previous studies have determined that the minimal clinically important difference for the WOOS score is 15 on a normalized 0 to 100 scale (100 being the best). The DASH score is a validated outcome measure for disorders of the upper extremity but is not specific to osteoarthritis of the shoulder.8 The Constant score is a validated outcome measure for a number of shoulder disorders, including TSA.9,10
STATISTICAL ANALYSIS
Statistical analyses were completed by a trained biostatistician. A power analysis was calculated using the noninferiority test to determine if adequate data had been obtained for this study. This was calculated by using previously accepted data demonstrating a statistically significant difference for subsidence and HAD. The data from these studies were used to make assumptions regarding accepted standard deviations and noninferiority margins, as calculated from the mean values of the 2 groups analyzed in each respective study.4,11 This analysis demonstrated power of 0.97 and 0.85 for the subsidence and HAD, respectively, given the current sample sizes. Intraclass coefficients were calculated to evaluate the measurements obtained during the radiographic analysis to determine the interrater agreement. Two samples’ t tests were calculated for the variables analyzed, along with P values and means.
RESULTS
DEMOGRAPHICS
A total of 51 consecutive patients were retrospectively selected for analysis. Of these, 16 patients were excluded from the study because they had <9 months of radiographic follow-up and were unavailable for further follow-up evaluation. Of the remaining 35 patients available for analysis, 4 patients had bilateral TSA, providing 39 shoulders for evaluation. Demographic characteristics of the study cohort are reported in Table 1.
| Table 1. Demographic Characteristics | |||
| Tenotomy (n = 24) | Osteotomy (n = 15) | P-value | |
| Age | 68.2 [7.4] | 70.2 [7.1] | 0.46 |
| Follow-up | 20.6 [11.5] | 18.5 [6.25] | 0.94 |
| Females | 7 (29%) | 6 (40%) | 0.58 |
| Dominant shoulder | 14 (58%) | 8 (53%) | 0.81 |
| Primary Diagnosis | |||
| Osteoarthritis | 22 (92%) | 15 (100%) | |
| Rheumatoid arthritis | 2 (8%) | 0 (0%) |
Fifteen patients underwent LTO, and 24 underwent ST. One patient underwent a tenotomy of the right shoulder and LTO of the left shoulder. Three LTOs were performed by the surgeon who primarily performed ST, owing to potential benefits of LTO. He eventually returned to his preferred technique of ST because of surgeon preference. Three ST procedures were completed by the surgeon who typically performed LTO at the start of the series prior to establishing LTO as his preferred technique. There was no significant difference between the study populations in terms of age, follow-up, male-to-female ratio, hand dominance, and primary diagnosis of osteoarthritis vs rheumatoid arthritis.
Continue to: There was no significant difference...