Setting
The DOM has approximately 1400 physician faculty members and is the largest clinical department at BWH. The DOMQP is comprised of a medical director (0.35 FTE) and 2 project coordinators (2 FTE) who operate in a consultative capacity to liaison between the various levels of clinical leadership and frontline staff. The DOMQP serves 13 divisions: 11 medical specialties, primary care, and the hospitalist service.
Internally Driven, Specialty-Specific Quality Metrics
The early stages of our efforts focused on engaging clinical leadership and physicians, navigating the hospital’s information systems (IS) to develop quality reports within the EHR and implementing strategies for improvement. Until 30 May 2015, BWH utilized an internally developed EHR comprising a myriad of individual systems (eg, billing, electronic medication administration, clinical repository) that did not interface easily with one another. To resolve the IS challenges, we engaged many levels of the organization’s IS structure and requested updates or developed workaround solutions leading to the integration of the various datasets for comprehensive reporting. This resulted in a new agreement between the hospital and Partners that allowed for billing data to be sent to the same repository that housed the clinical data.
We developed at least one data report for each specialty division. The divisions selected a quality measure, and we worked with clinical leadership to define the numerator and denominator and identify any additional information they wanted in the report, eg, demographics, visit dates, labs. To produce the report, an IS consultant compiles the data elements on an excel spreadsheet. This spreadsheet is then manually chart reviewed by the DOMQP for accuracy before it is converted into a report. The report is then reviewed by the DOMQP to ensure the information is presented correctly and is easily interpreted, and then shared with the division champion(s), who determine how to message and introduce a proposed improvement effort before it is shared with the entire division.
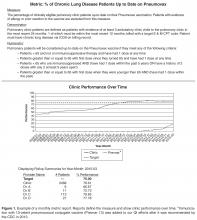
Reports display a graph showing overall performance of the division and individual provider rates (an example is shown in Figure 1 ). Currently, most reports are sent unblinded; previously it was left to the discretion of the division chief. Patients are attributed to the provider they have seen most often during the reporting period. If there is a tie between 2 providers the patient is attributed to the most recent provider. Provider-level reports are also developed to show the physician’s performance over time as compared to the division’s overall performance. The reports list the provider’s patients and their performance status on the metric. We found that identifying patients not meeting the metric are essential to gaining clinician buy-in [11]. Physicians can be skeptical of baseline data if the rationale and details around how measurement was performed are not clearly communicated. Concrete examples with their own patient panel provide the proof they need and the relevant caveats and limitations of the data, in order to work toward improvement. We have seen clinic improvement on many metrics, with some clinics improving from 40% to over 88% in 2 to 3 years [12,13] ( Table 1 ).

