Article
Burnt Out ? The Phenomenon of Type 2 Diabetes Mellitus in End-Stage Renal Disease
In patients with T2DM and ESRD, insulin is the antidiabetic medication of choice with a hemoglobin A1c target of 6 to 8%, using fructosamine...
Dr. Ramirez is Assistant Chief of Endocrinology, Dr. Weare-Regales is a staff endocrinologist, Dr. Foulis is Chief, Pathology Informatics, Pathology and Laboratory Medicine service, and Dr. Gomez-Daspet is Chief of Endocrinology, Diabetes, and Metabolism section, all at the James A. Haley Veterans’ Hospital in Tampa, Florida. Dr. Ramirez and Dr. Weare-Regales are Assistant Professors, and Dr. Gomez-Daspet is Associate Professor and Director of the Endocrinology, Diabetes and Metabolism Fellowship Training program, all at University of South Florida Morsani College of Medicine in Tampa. Dr. Domingo is a founder and practicing physician at Miami Endocrinology Specialists in Aventura, Florida. Dr. Villafranca is a founder and practicing physician at Team Endocrine in Pembroke Pines, Florida. Dr. Valdez is an endocrinologist at First California Physician Partners in Templeton, California. Dr. Velez is a clinical epidemiology Professor at Facultad de Medicina at Universidad de Antioquia in Medellin, Colombia.
Correspondence: Alejandro Ramirez (alejandro.ramirez@va.gov)
Author disclosures
The authors report no actual or potential conflicts of interest with regard to this article.
Disclaimer
The opinions expressed herein are those of the authors and do not necessarily reflect those of Federal Practitioner, Frontline Medical Communications Inc., the US Government, or any of its agencies. This article may discuss unlabeled or investigational use of certain drugs. Please review the complete prescribing information for specific drugs or drug combinations—including indications, contraindications, warnings, and adverse effects—before administering pharmacologic therapy to patients.
Data were collected using the automatic data mining tools within the JAHVA Computerized Patient Record System and confirmed individually by clinical staff. Demographic data included age, race, and sex. Other parameters were weight; BMI; Hb A1C; estimated glomerular filtration rate (eGFR); duration of DM; use of metformin and other oral agents; total daily insulin dose; number of daily injections; prior history of atherosclerotic cardiovascular disease (ASCVD), including coronary artery disease (CAD), cerebrovascular accident (CVA), or peripheral vascular disease (PVD); occurrence of severe hypoglycemia (symptomatic hypoglycemia requiring treatment assistance from another individual) and of new cardiovascular events, classified as CAD, CVA, or PVD.
For the U-500 group, data were collected and analyzed for the 3 months before (baseline) and the 12 months after the initiation of concentrated insulin. For the U-100 group, data were collected and analyzed for the comparable 3 months before (baseline) and the 12 months after the first clinic visit in which the subject started using more than 200 units per day of U-100. Frequency of follow-up visits was individualized according to clinical needs.
Primary outcomes included changes in Hb A1C from baseline to the following 12 months, and the occurrence of severe hypoglycemia. Secondary outcomes included the occurrence of new ASCVD events during the study, and changes in weight, BMI, and number of injections.
A descriptive analysis was applied to the categorical variables using absolute and relative frequencies. For continuous variables, mean and SD, or median and interquartile range, according to the distribution were calculated. Differences in baseline characteristics between groups were determined using chi-square and t test.
The primary and secondary outcomes were assessed through univariate and multivariate general linear models. Multivariate models were used to compare differences in the variation of Hb A1C over time. Data were incomplete for the Hb A1C in 27 subjects, 6% of the dataset (Each subject had more than one variable or observation). Therefore, a multiple imputation was used to account for the incompleteness on Hb A1C (value substitutions by the mean and by the prior Hb A1C and models were balanced against the unaltered data). A P value of ≤ .05 was used to determine statistical significance. The statistical analyses were performed using IBM SPSS Statistics 21.
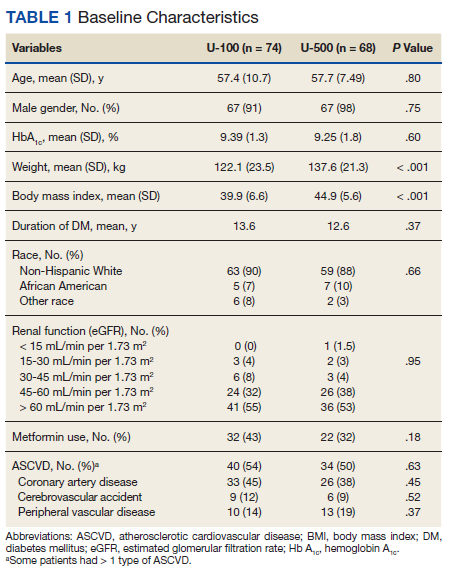
Most patients were male (94%) of white race (86%), with a mean age of 57 years and comparable duration of DM (Table 1). Demographics were balanced between the groups, except for weight and BMI, both higher in the U-500 group (P < .001). Use of oral antidiabetic agents was not significantly different between groups, nor were comorbid conditions, with nearly 50% of subjects in each group affected by CKD and ASCVD, of which CAD was the most common (approximately 40% of both groups). Only about one-third of subjects used metformin and/or other oral agents, likely due to the high prevalence of CKD (contraindicating metformin) and high insulin requirements (due to correlation with β cell failure). A subgroup analysis of subjects on metformin did not demonstrate significant differences in risk of severe hypoglycemia or in Hb A1C levels (data not shown).
Both groups had similar initial Hb A1C baselines (> 9%) and both improved glycemic control during the study period. However, the Hb A1C reduction was greater in the U-500 group (P= .034), 0.84% vs 0.56% for U-100 and the between-groups difference was 0.4%. (Figure 1, Tables 2 and 3).
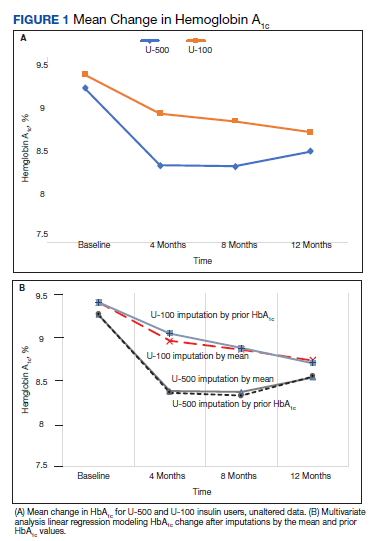
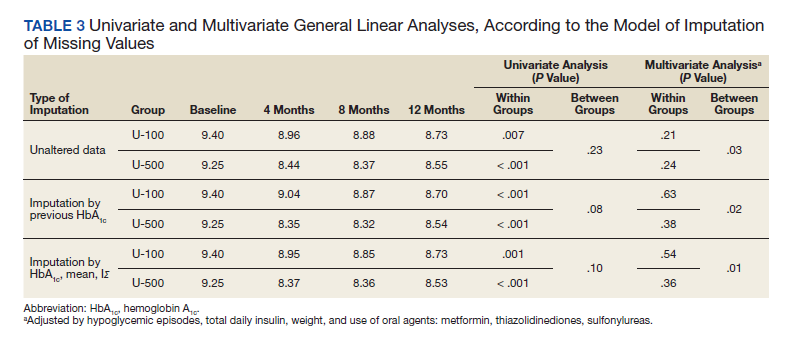
The univariate general linear model shows a statistically significant difference in the levels of Hb A1C within each treatment group, regardless of the imputation strategy. However, the differences were not significant when comparing postintervention Hb A1C means between groups with unaltered data (P = .23), because the U-500 group Hb A1C improvement gap narrowed at the end of study. In the multivariate analysis, irrespective of imputation method, the differences in Hb A1C between group treated with U-100 and U-500 were statistically significant (Table 3).
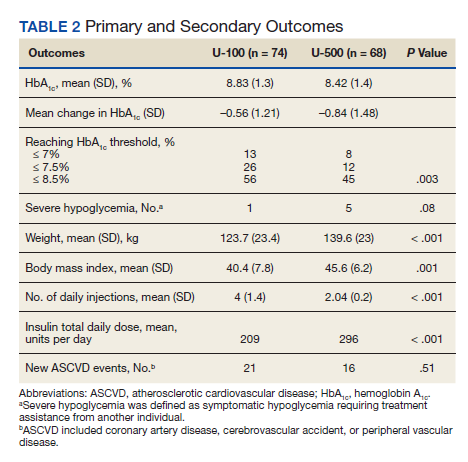
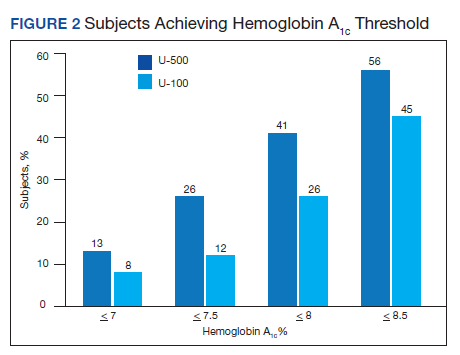
Overall, more subjects in the U-500 group than in the U-100 group achieved Hb A1C levels < 8.5% (56% vs 46%, respectively, P = .003) and the proportion of subjects achieving Hb A1C levels < 7.5% doubled that of the U-100 group (26% vs 12%; Figure 2). Five subjects in the U-500 group experienced severe hypoglycemia, compared with 1 in the U-100 group (P = .08). The total daily insulin dose was significantly higher in the U-500 group (296 units daily) than in the U-100 group (209 units daily) (P < .001) (Table 2). Baseline weight and BMI differences were also significant for the U-500 and U-100 groups (P < .001). Weight gain of approximately 2 kg occurred in both groups, a change that was not statistically significant (P = .79)
There were 21 new ASCVD events in the U-100 and 16 in the U-500 group (P = .51) and there were no statistically significant differences in the incidence of new CAD, PVD or CVA events. The U-500 group required significantly fewer injections than U-100 insulin users (2 vs 4; P < .001).
In patients with T2DM and ESRD, insulin is the antidiabetic medication of choice with a hemoglobin A1c target of 6 to 8%, using fructosamine...
Patients who were previously antipsychotic-naïve and nondiabetic may be at increased risk of progression to type 2 diabetes mellitus when compared...
Further study of the long-term implications and follow-up is needed on SGLT2 mutation, an uncommon cause of glucosuria that mimics the effect of...