Mr. A’s antidiabetic regimen is 45 units of subcutaneous insulin glargine every morning; insulin aspart sliding scale (about 15-27 units) subcutaneous 3 times daily with meals; and saxagliptin 2.5 mg by mouth once daily.
At a follow-up visit with the CPS, Mr. A stated, “I feel fine except for the occasional low blood sugar episode.” The patient’s most recent HbA1c was 6.1%, and he reported medication adherence and no signs or symptoms of hyperglycemia (ie, polydipsia, polyphagia, nocturia, visual disturbances). Mr. A reported no use of alcohol, tobacco, or illicit drugs. He walks 1 mile every other day and participates in self-monitoring blood glucose (SMBG) about 2 to 3 times daily (Table 1).
Although Mr. A’s most recent HbA1c was well controlled, his estimated fasting blood glucose at the same laboratory draw was 224 mg/dL. His SMBG readings in the past month also were elevated with higher readings in the evening. Mr. A attributed the elevated readings to dietary excursions and a high carbohydrate intake. At this visit, the CPS increased his insulin glargine dose to 50 units subcutaneous every morning and educated him on lifestyle modifications. Follow-up with the CPS was scheduled for 2 months from the day of the visit.
Analysis
Few articles on potential contributors to burnt-out diabetes have been published.6,7 These articles discuss decreased renal and hepatic clearance of insulin (which increases its half-life) hypoglycemia during HD, and low HbA1c due to preexisting anemia. Inappropriately low HbA1c levels may be secondary to, but not limited to, hemolysis, recent blood transfusion, acute blood loss, and medications, such as erythropoietin-stimulating agents (ESAs).9 The conditions that affect red blood cell turnover are common in patients with advanced CKD and may result in discrepancies in HbA1c levels.
Glycated hemoglobin is a series of minor hemoglobin components formed by the adduction of various carbohydrate molecules to hemoglobin. HbA1c is the largest fraction formed and the most consistent index of the concentration of glucose in the blood.10 Hence, HbA1c is the traditional indicator of overall glycemic control. The current HbA1c goals recommended by the American Diabetes Association are derived from landmark trials conducted with patients in the general adult diabetic non-CKD population. However, hemoglobin measurements can be confounded by conditions present in ESRD and tend to underestimate glucose measurements in patients with T2DM on HD. Despite this, HbA1c is still regarded as a reasonable measure of glycemic control even in patients with ESRD; however, alternative markers of glycemia may be preferable.11
Although HbA1c is the gold standard, there are other laboratory measures of average glycemic control available. Fructosamine is a ketoamine formed when glucose binds to serum proteins. When these proteins are exposed to high concentrations of glucose, they experience increased glycation. Fructosamine assays measure the total glycated serum proteins, of which albumin accounts for about 90%.11 Because the half-life of serum proteins is about 20 days, fructosamine levels can reflect glycemic control over a 2- to 3-week period. This is advantageous in conditions that affect the average age of red blood cells, in pregnancy where frequent monitoring and measures of short-term glucose control are especially important, and in the evaluation of a medication adjustment in the management of T2DM. However, this test is not without its limitations. It is less reliable in settings of decreased protein levels (eg, liver disease), there is a lack of availability in routine practice, and reference levels have not been established.11
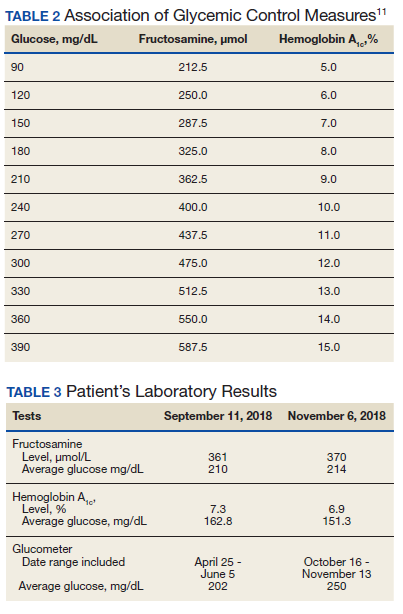
Fructosamine has been shown to be strongly associated with mean blood glucose and HbA1c (Table 2). In 2010, Mittman and colleagues published a study that compared HbA1c with fructosamine and their correlation to glycemic control and morbidity, defined as rates of hospitalization and infection.12 The study included 100 patients with T2DM on HD with a mean age of 63 years, 54% were women, mean HbA1c of 7.2%, and mean dialysis duration of 3 years. Average follow-up was 3 years. At the end of follow-up, Mittman and colleagues found that HbA1c and fructosamine were highly correlated and associated with serum glucose (P < .01). However, fructosamine was found to be more highly correlated with mean glucose levels when those levels were below 150 mg/dL (P = .01). A higher fructosamine level, not HbA1c was a more significant predictor of hospitalization (P = .007) and infection (P = .001). Mittman and colleagues presented evidence for the use of fructosamine over HbA1c in patients with T2DM on HD.12