Quality Measure Attainment After Add-on Therapy of Both Saxagliptin and Dapagliflozin to Metformin Versus Single Add-On of Saxagliptin or Dapagliflozin
Journal of Clinical Outcomes Management. 2016 September;23(9)
References
Results
Patients
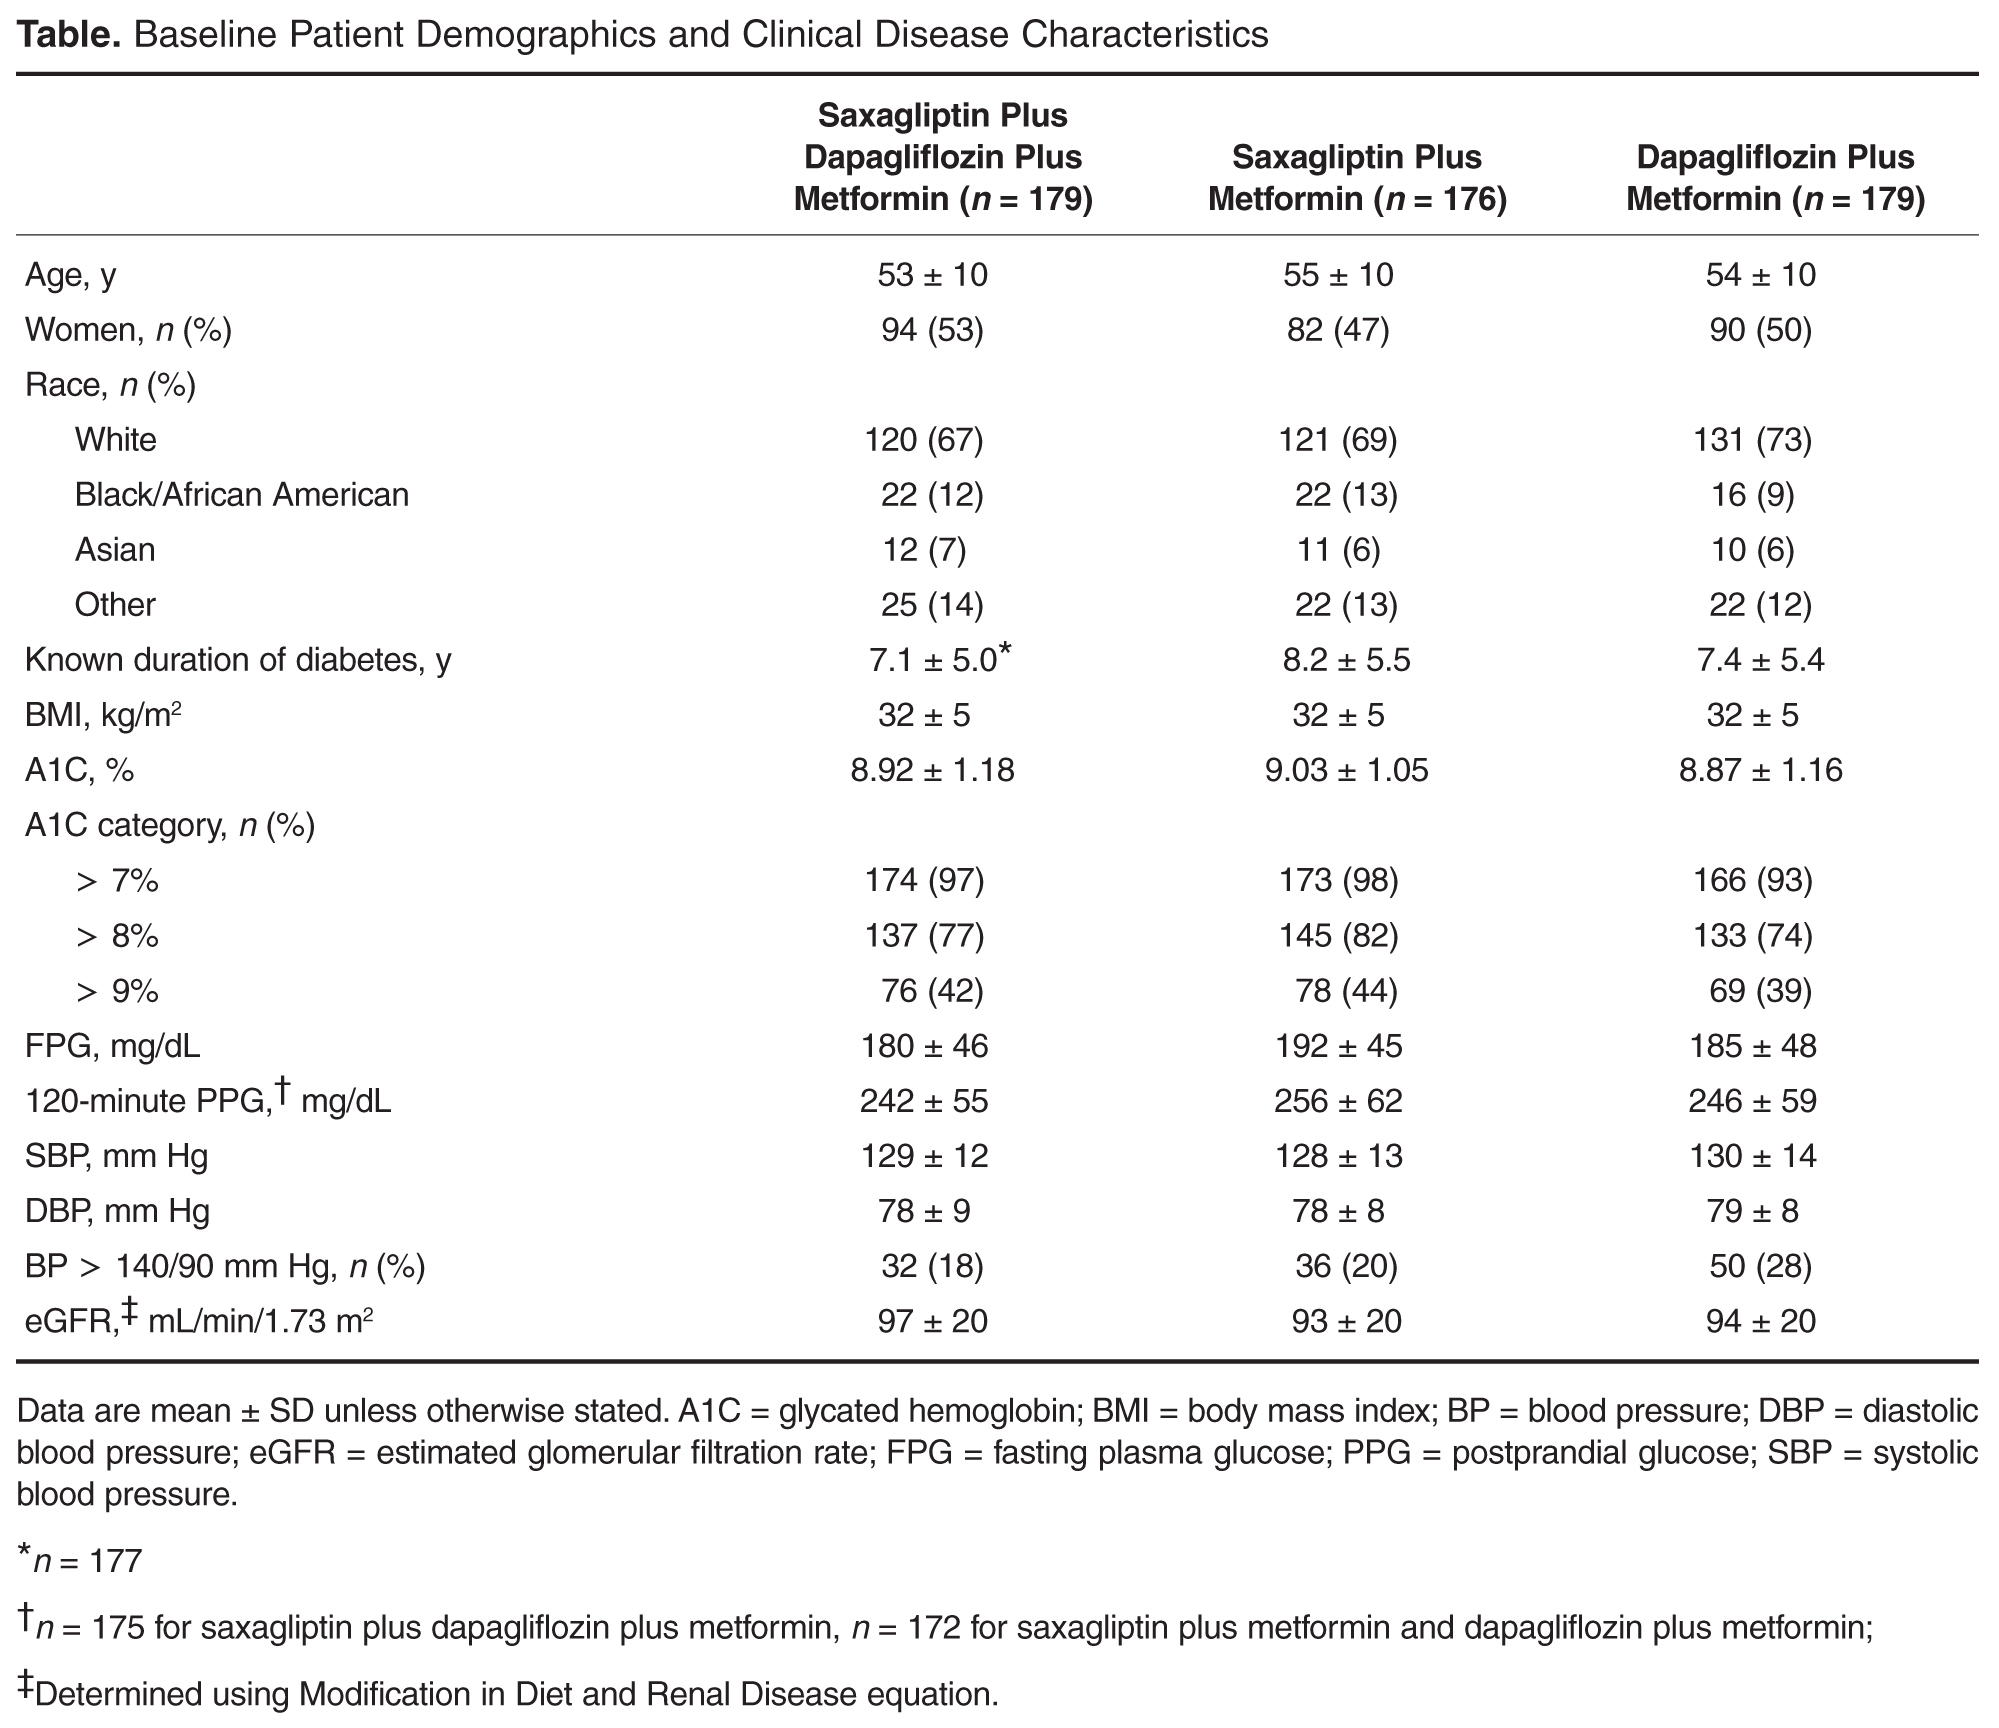
Patient disposition, baseline demographics, and disease characteristics have been previously published [15]. A total of 534 patients were randomized to saxagliptin plus dapagliflozin plus metformin ( n = 179), saxagliptinplus metformin ( n = 176), or dapagliflozin plus metformin ( n= 179) and received ≥ 1 dose of study medication. Patient demographics and baseline disease characteristics were generally balanced across all 3 treatment groups ( Table). Mean age across the 3 treatment groups was 54 years, and there was a generally equal distribution of men and women. The mean known duration of T2D across the 3 treatment groups was 7.6 years, and mean baseline A1C was 8.94%. At baseline, 93% to 98% of patients had A1C > 7%, 74% to 82% had A1C > 8%, and 39% to 44% had A1C > 9%. At baseline, 18% to 28% of patients had BP > 140/90 mm Hg.
Individual Quality Measures
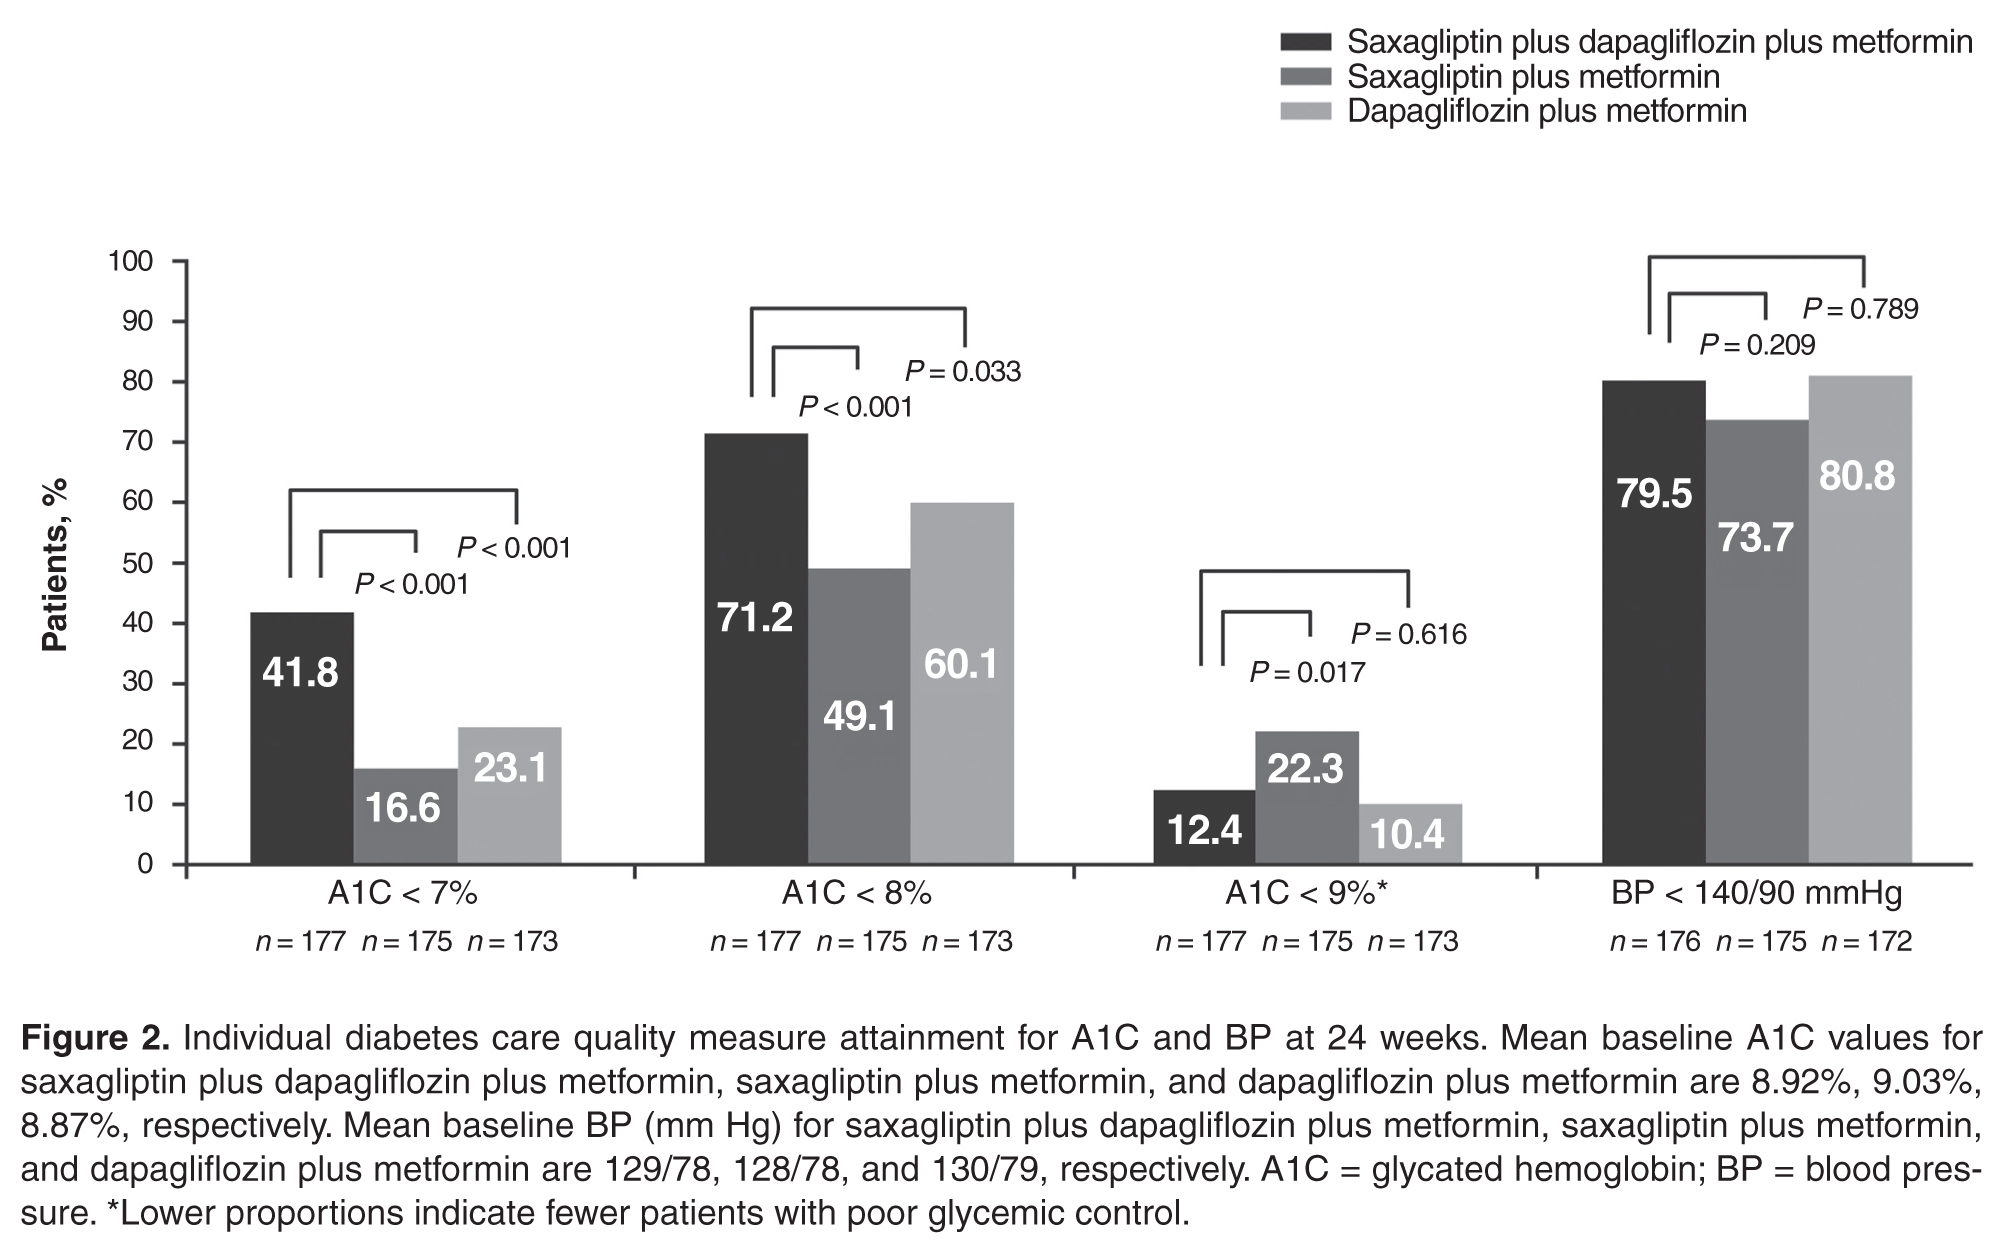
A significantly greater proportion of patients attained A1C < 7% (good glycemic control) with the dual add-on of saxagliptin plus dapagliflozin to metformin (41.8%) compared with saxagliptin plus metformin (16.6%, P < 0.001; NNT 4, 95% confidence interval [CI], 3–6) or dapagliflozin plus metformin (23.1%, P < 0.001; NNT 5, 95% CI, 4–11; Figure 2 ). The data were similar when the analysis excluded patients with baseline A1C < 7% (proportions of patients: 40.8% vs 15.6% vs 21.1%; P < 0.001 for both; NNTs 4 [95% CI 3–6] and 5 [95% CI 3–10]).
The dual addition of saxagliptin plus dapagliflozin to metformin resulted in a significantly greater proportion of patients achieving A1C < 8.0% compared with saxagliptin plus metformin (71.2% vs 49.1%; P < 0.001; NNT 5 [95% CI 3–8]) or dapagliflozin plus metformin (60.1%; P = 0.033; NNT 9 [95% CI 5–85]; Figure 2). Similar results (proportions of patients: 66.4% vs 40.0% vs 51.9%; P ≤ 0.02; NNTs 4 [95% CI 3–7]) and 7 [95% CI 4–34]) were attained when the analysis excluded patients with baseline A1C < 8.0%.
Significantly fewer patients had A1C > 9% (a measure of poor glycemic control) with saxagliptin plus dapagliflozin plus metformin (12.4%) compared with saxagliptin plus metformin (22.3%; P = 0.017; NNT –10 [95% CI –50 to –6]; Figure 2). The proportion of patients with A1C > 9% was similar for both regimens that included dapagliflozin (12.4% vs 10.4%; P = 0.616).
No significant difference was observed among treatment groups in the proportion of patients with BP < 140/90 mm Hg (Figure 2). However, most patients had BP < 140/90 mm Hg (72%–82%) at baseline, which was generally maintained at week 24.
Composite Quality Measures
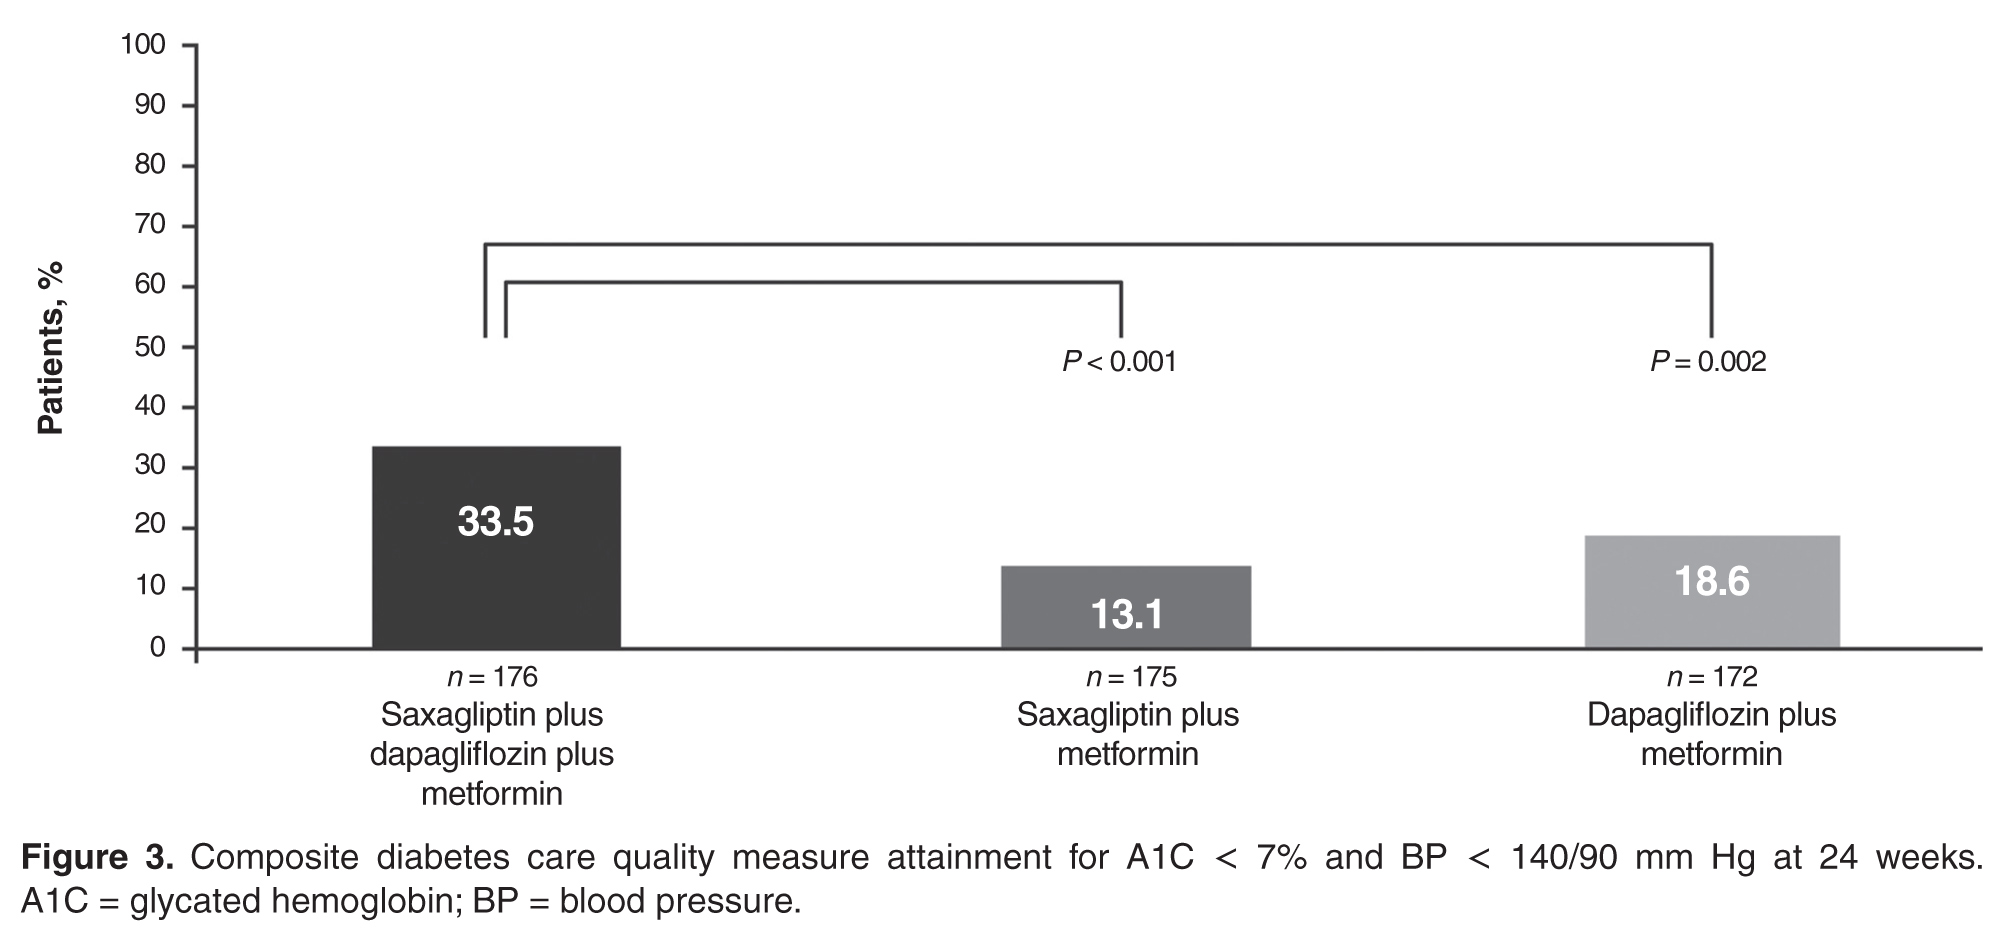
A significantly greater proportion of patients attained the composite of A1C < 7% and BP < 140/90 mm Hg with saxagliptin plus dapagliflozin plus metformin (33.5%) compared with saxagliptin plus metformin (13.1%; P < 0.001; NNT 5 [95% CI 4–9]) or dapagliflozin plus metformin (18.6%; P = 0.002; NNT 7 [95% CI 4–17]; Figure 3 ). Results were similar when patients already at these goals at baseline were excluded from the analysis (32.4% vs 12.1% vs 16.3%; P