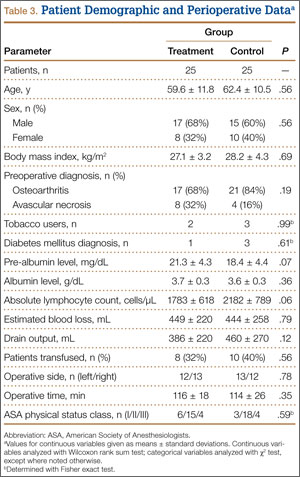
To account for any effect of nutrition status on wound healing, we obtained pre-albumin and albumin levels and absolute lymphocyte counts from the preoperative electronic records. We used an albumin level under 3.5 g/dL and an absolute lymphocyte count under 1500/µL for our analysis, as these cutoffs have been associated with wound complications after primary THA.21 There is no similarly established threshold for pre-albumin level, so we used values under 20 mg/L based on comparable literature.22,23
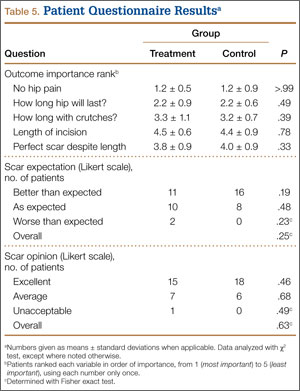
At each postoperative visit, standardized high-resolution images were obtained. At the 12-week visit, patients completed 2 Likert scales regarding their overall opinion of their scars and how their scars compared with their expectations. They also ranked 5 separate THA-related outcomes in order of importance (Appendix).
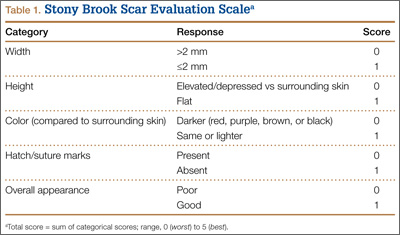
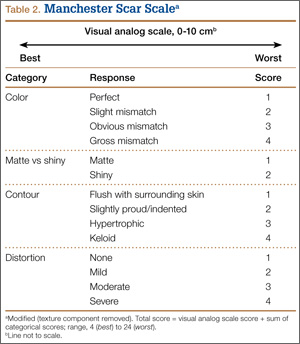
Photographs were evaluated by 2 blinded plastic surgeons (Dr. Friedman and Dr. Jack) using 2 grading systems—the Stony Brook Scar Evaluation Scale (SBSES)24 (Table 1) and a modified Manchester Scar Scale (MSS)25 (Table 2). We used these systems because they were photograph-based, psychometrically studied, and specifically designed to assess surgical incision healing with established validity and reliability.24-27 A particular advantage, strictly related to cosmetic outcome, is their validity in scoring scars from high-definition photographs in a different place or time. The SBSES, an ordinal wound evaluation scale that measures short-term cosmetic outcomes, consists of 6 items, each receiving 1 or 0 point, yielding a total score between 0 (worst) and 5 (best). The modified MSS includes a visual analog scale (VAS), which has a vertical hash marked on a 10-cm line and is scored between 0 (excellent) and 10 (poor) to 1 decimal point.26,28 This value is added to grades on color, surface appearance, contour, and distortion, resulting in a score between 4 (best) and 24 (worst). The primary outcome measures were Likert-scale responses obtained at final visit and SBSES/MSS scores for each visit; 12-week scores were the primary end point.
Operative Procedure
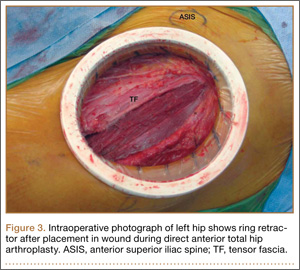
Experienced fellowship-trained orthopedic surgeons performed all procedures. A modified Hueter approach was used for exposure.9 Mean incision length was about 12 cm. For the treatment group, the ring retractor was inserted at the level of the tensor fascia, with the inferior ring resting between the fascia and the subcutaneous layer and the superior ring cinched over the skin (Figure 3). The device is made in 4 different sizes for incisions from 2.5 to 17 cm; our study population required only 1 size. Otherwise, the surgical protocol was based on that described by Matta and colleagues.8 Wound closure (over a drain) was performed according to a standardized protocol—running No. 1 Vicryl suture for the superficial tensor fascia, interrupted 2-0 Vicryl for the deep dermal layer, and subcutaneous 4-0 Monocryl for the skin followed by application of Dermabond (Ethicon, Somerville, New Jersey) and Tegaderm +Pad (3M, St. Paul, Minnesota) for outer dressing, which was replaced on postoperative day 2 and removed at the 2-week visit.
Statistical Methods
An a priori sample-size calculation was performed. Power performed in a base of a prior study that evaluated anterolateral and posterolateral THA scars using a VAS, a component of the MSS, suggested a sample size of 16 per group to detect the minimal clinically important difference of 1.5 cm: SD (σ) = 1.5 cm, α = 0.05, β = 0.20.29,30 In addition, a general estimate for detecting a 1-unit change on an ordinal scale (σ = 1.0, α = 0.05, β = 0.20) resulted in the same number. We conservatively decided to enroll 25 patients per arm in case of larger true variance.
The Wilcoxon rank sum test was used for comparisons of continuous data between groups. Differences between means were analyzed with 2-sided t tests. Categorical data were compared with the Pearson χ2 test or the Fisher exact test, as indicated. Ordinal ranking scores were compared with the Mantel-Haenszel test. Multivariate logistic regression was applied to identify the significant independent predictors of better scar grades for each surgeon by considering candidate variables with Ps < .20 in the univariate analysis.
Results
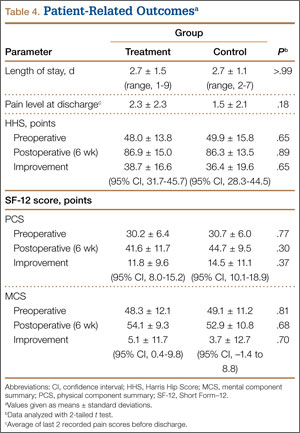
We found no differences in demographic or perioperative characteristics between treatment and control groups (Tables 3, 4). The groups showed similar mean improvements in their respective 6-week HHS (38.7 and 36.4 points; P = .65), SF-12 physical component summary scores (11.8 and 14.5 points; P = .37), and SF-12 mental component summary scores (5.1 and 3.7; P = .70).
Patient questionnaire outcomes are listed in Table 5. For the control group, 25/25 image sets were obtained at the 2-week visit, 25/25 at the 6-week visit, and 24/25 at the 12-week visit. For the treatment group, there were 23/25, 24/25, and 23/25 images sets, respectively.