RESULTS
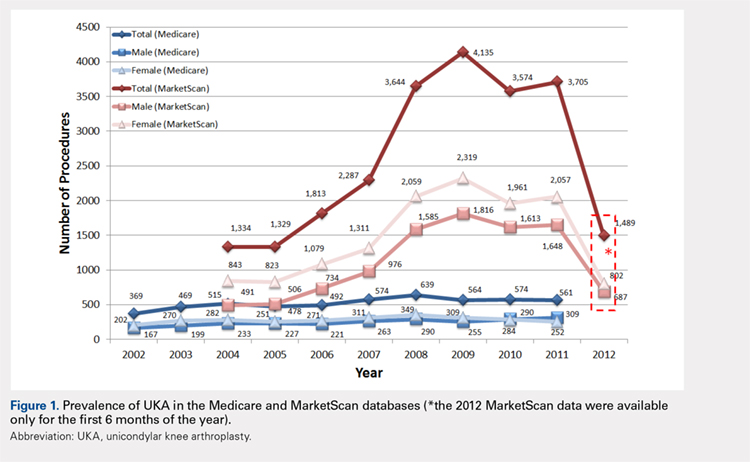
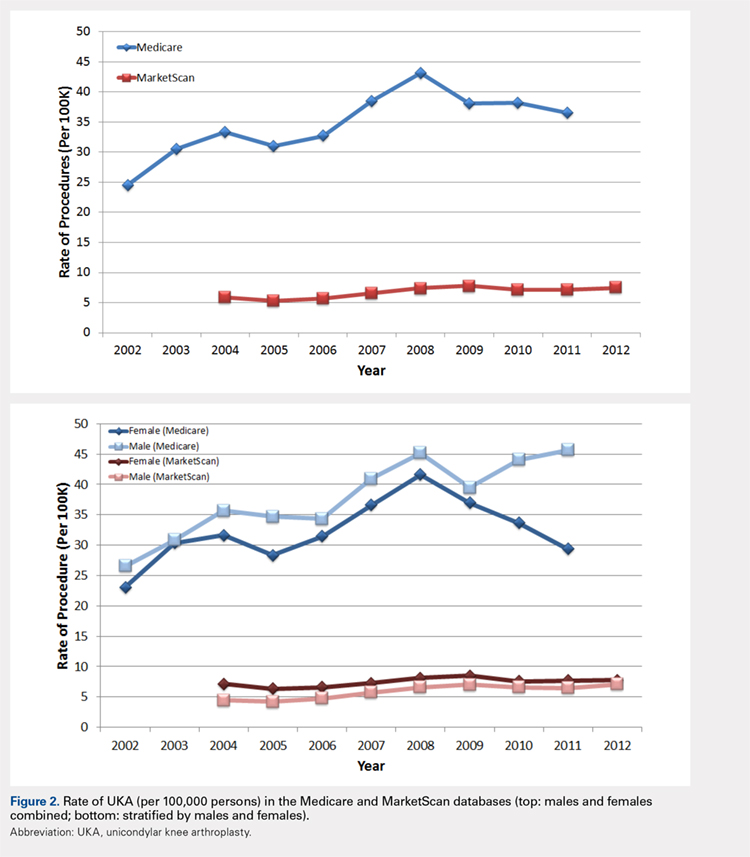
For the time periods analyzed, a total of 5235 and 23,310 UKA procedures were identified from the 5% Medicare and MarketScan databases, respectively. A peak in the prevalence appeared around 2008 for the elderly population and in 2009 for the younger population (Figure 1). When normalized by the size of the population segment, the rate of UKA was found to be approximately 5 times greater in the elderly population, increasing from 369 in 2002 to 639 in 2008, but plateauing to 561 in 2011. Extrapolating to the 100% Medicare population, these numbers increased to 7380, 12,780, and 11,220, respectively. Temporal changes in the UKA rate were significant, increasing from 24.5 UKAs per 100,000 persons in 2002 to 43.1 UKAs in 2008, followed by a decline to 36.5 in 2011 (P < .0001) (Figure 2). The rates of UKA generally increased from 2002 to 2008 for both males and females in the Medicare cohort; however, the rates of UKA in female patients continuously declined from 2008 onward, whereas the UKA rates in male patients decreased in 2009, followed by an increase in 2010 and 2011 (Figure 2). For the younger population, there was a slight increase in the rate of UKA from 2004 to approximately 2009, after which the rates for both males and females remained relatively steady. When put in the context of the prevalence of TKA, the prevalence of UKA fluctuated during the same time period. In the Medicare population, the prevalence of UKA ranged from 4.3% (2005) to 5.9% (2008) of the TKA prevalence between 2002 and 2011. In the younger MarketScan population, the prevalence of UKA ranged from 6.7% (2005) to 8.9% (2008) between 2004 and June 2012.
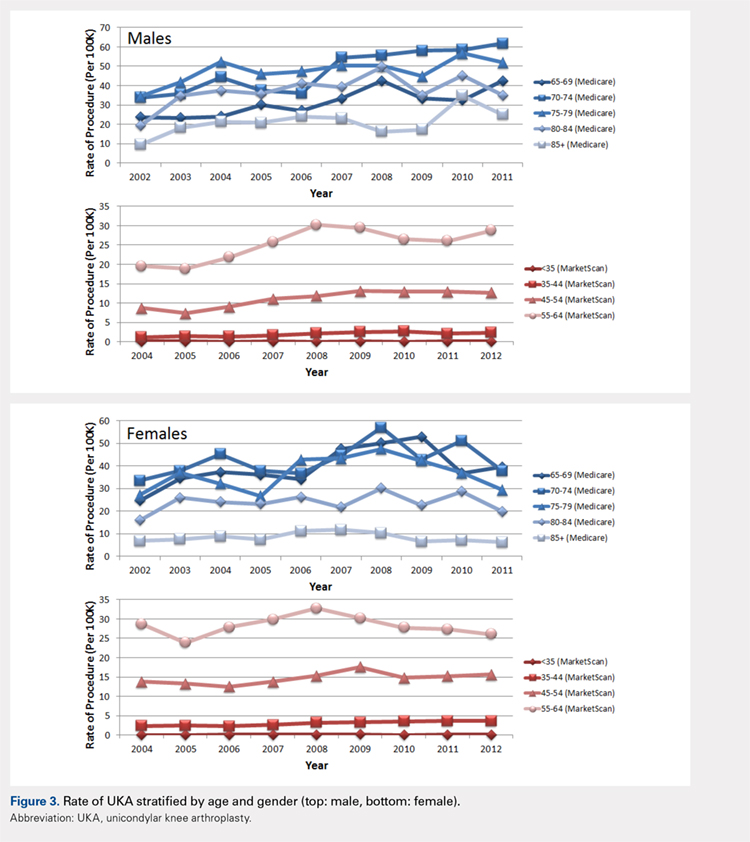
The UKA rate differed significantly according to gender (P = .0209), with higher rates for males. Although there were no age-related differences (P = .3723), age–gender interactions were found to be significant (P < .0001). For males, the largest rate of UKA in the most recent year of data was observed in the 70- to 74-year-old group, followed by the 75- to 79- and the 65- to 69-year-old groups (Figure 3). For females, those in the 65- to 69- and the 70- to 74-year-old groups had the highest rate of UKA. In the younger cohort, there were increases in the UKA rates since 2004. These rates appeared to be relatively stable from the 2008 or 2009 period onward, except for females 55–64 years, which demonstrated a steady decline since 2008. Analysis of data obtained over the past few years showed that males 55–64, 65–69, and 70–74 years were the only age–gender groups whose UKA rates appeared to be trending upward.
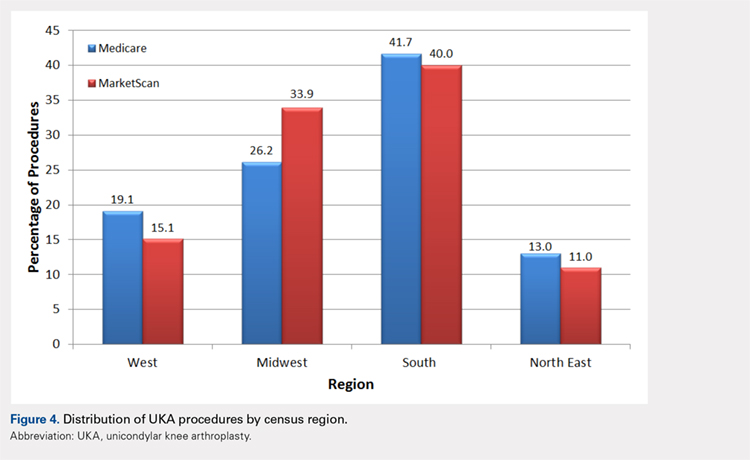
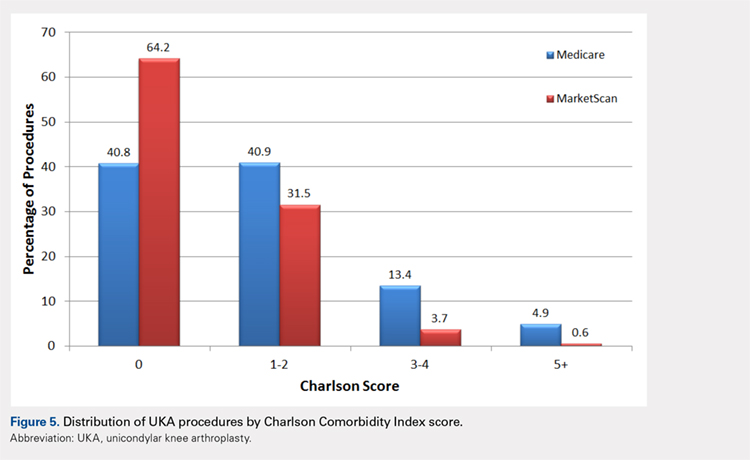
The vast majority of elderly UKA patients were white (95.5%), and when stratified by census region, the highest proportion of UKA procedures was observed in the South and the Midwest (Figure 4). Furthermore, among patients <65 years, 64.2% had a Charlson score of 0 compared to 40.8% in the elderly group (Figure 5). For the Medicare population, based on their receipt of state subsidies for their insurance premiums, 5.1% of patients were of lower socioeconomic status. Osteoarthritis was diagnosed in 99.4% and 97.3% of the MarketScan and Medicare cohorts, respectively.
In the Medicare cohort, gender (P = .0209) and year of operation (P < .0001) were found to be significantly associated with the rate of UKA, along with age-gender (P < .0001) and gender-year (P = .0202) interaction terms. In the MarketScan cohort, age (P = .0173), gender (P = .0017), and year of operation (P = .0002) were found to be significantly associated with UKA rate. Two-way interactions between age-gender (P = .0018), age–year (P = .0207), and gender-year (P = .0017) were also found to be statistically significant factors.
Continue to: DISCUSSION...