TABLE 2
How lipid concentrations are determined
| TC = apoA-I-C + apoB-C |
| TC = HDL-C + LDL-C + VLDL-C + IDL-C + Chylomicron-C + Lp(a)-C + Remnant-C |
| In a fasting patient under normal circumstances, there are no chylomicrons and remnants (smaller chylomicrons or VLDL particles) and very few, if any, IDL particles. These are postprandial lipoproteins. Most patients do not have Lp(a) pathology. Therefore, the lipid concentration formula simplifies: |
| TC = HDL-C + LDL-C + VLDL-C |
| VLDL-C is estimated by TG/5 (assumes that all TG is in VLDL and that VLDL TG:cholesterol composition is 5:1). Therefore: |
| TC = HDL-C + LDL-C + TG/5 |
| LDL-C = TC – (HDL-C + TG/5) |
| Non-HDL-C = TC – HDL-C |
| In actuality, the calculated or directly measured LDL-C values in the standard lipid panel represent LDL-C + IDL-C + Lp(a)-C. However, because labs do not usually separate IDL and Lp(a) particles from LDL (without significant added expense), only total LDL-C is reported. |
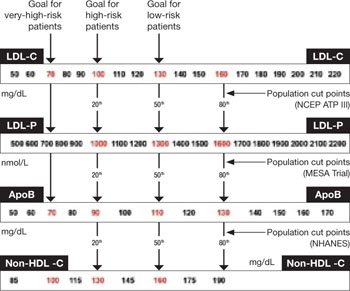
FIGURE Population percentile cut points and goals for LDL-C, LDL-P, ApoB, and non-HDL-C
HDL-C, apoA-I are inversely related to cardiovascular risk
The epidemiologic data strongly indicate that both HDL-C and apoA-I are strongly and inversely related to CVD risk.6 HDL particles are a heterogenous collection of:
- unlipidated apoA-I
- very small pre-beta HDL
- more mature, lipidated HDL3 and HDL2 species (HDL3 smaller than HDL2).
NMR nomenclature identifies the smaller HDL species as H1 and H2 and the larger HDL species as H4 and H5.14 The smaller HDL species also contain apoA-II.
Although HDL can acquire cholesterol from any cell, including arterial-wall foam cells, the majority of HDL lipidation occurs in the liver or proximal small intestine, after which it is trafficked to steroidogenic tissue, adipocytes, or back to the liver. Normally, HDL carries little TG.20 The only lipid concentration that can serve as a surrogate of apoA-I or HDL-P is HDL-C, where the assumption is that higher HDL-C indicates higher apoA-I, and vice versa.
In reality, the correlation between apoA-I and HDL-C varies because each HDL particle can have from two to four apoA-I molecules, and the volume of cholesterol within the particle is a function of particle size and its TG content. For the most part, total HDL-C is indicative of the cholesterol carried in the larger, mature HDL2 (H4, H5) particles; patients with low HDL-C typically lack these mature, lipidated HDL particles.
Because HDL rapidly and repeatedly lipidates and then delipidates, there is no relationship between the HDL-C level and the complex dynamic process termed reverse cholesterol transport process. Neither HDL-C, nor apoA-I, nor HDL-P, nor HDL size is consistently related to HDL particle functionality—i.e., the ability of HDL to lipidate or delipidate, appropriately traffic cholesterol, or perform numerous other nonlipid antiatherogenic functions.20,21
Two patients, similar lipid profiles: Why is only one at heightened risk?
Two premenopausal women undergo assessment of their basic lipid panel, with these results:
| LIPID | PATIENT 1 | PATIENT 2 |
|---|---|---|
| Total cholesterol (TC) | 180 | 180 |
| LDL-C | 100 | 100 |
| HDL-C | 60 | 40 |
| VLDL-C | 20 | 40 |
| Triglycerides (TG) | 100 | 200 |
| Non-HDL-C | 120 | 160 |
| TC/HDL-C ratio | 3.0 | 4.5 |
| TG/HDL-C ratio | 1.6 | 5.0 |
| LDL-C, low-density lipoprotein cholesterol | ||
| HDL-C, high-density lipoprotein cholesterol | ||
| VLDL-C, very-low-density lipoprotein cholesterol | ||
Both patients have the same desirable TC and LDL-C values. However, further analysis reveals an abnormal TC/HDL-C ratio and an abnormal non-HDL-C level in patient 2. This finding indicates a higher risk of CVD.
In addition, the TG/HDL-C ratio of 5.0 in patient 2 is highly suggestive of small-LDL phenotype B. That designation means that this patient will have 40% to 70% more LDL particles to traffic her LDL-C than patient 1, who appears to have LDL of normal size.27 The elevated VLDL-C of patient 2 indicates the presence of VLDL remnants, which predict risk above that conveyed by LDL-C.7
The typical clinician, looking only at TC or LDL-C, would miss the increased risk (high apoB) in patient 2. Obvious clues to her lipoprotein pathology are the elevated TG and reduced HDL-C (TG-HDL axis disorder). Beyond elevated TG and reduced HDL-C, patient 2 is also likely to have increased waist size, subtle hypertension, and possibly impaired fasting glucose—three additional parameters of metabolic syndrome.7,10,25
Focus on lipoprotein particle concentrations
To most accurately predict lipid-related CVD risk, you must determine which patients have elevated numbers of atherogenic lipoproteins using actual particle concentrations. In most practices, lipoprotein particle numbers must be estimated by scrutinizing all of the lipid concentrations and ratios (not simply LDL-C).
TC and, especially, LDL-C are apoB and LDL-P surrogates, but the best lipid concentration estimate of apoB is the calculated non-HDL-C value. By subtracting HDL-C from TC, it is possible to identify the cholesterol not in the HDL particles but in all of the potentially atherogenic apoB particles. In essence, non-HDL-C is VLDL-C plus LDL-C. This equation yields a better apoB or LDL-P proxy, compared with LDL-C alone.18 If a patient has reached her LDL-C goal but still has a high non-HDL-C level, we can assume that there are still too many apoB particles and that they are contributing to residual risk.