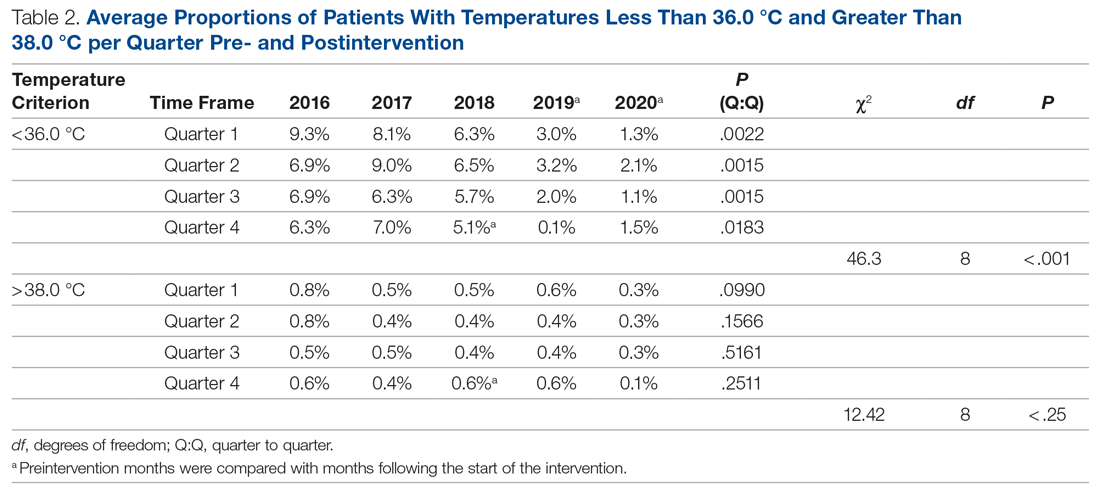
We performed additional analysis to adjust for different time periods throughout the year. The time period between January 2016 and October 2018 was considered preintervention. We considered November 2018 the start of our intervention, or more specifically, the start of our PDSA cycles. October 2018 was analyzed as part of the preintervention data. To account for seasonal temperature variations, the statistical analysis focused on the comparisons of the same calendar quarters for before and after starting intervention using Wilcoxon Mann-Whitney U tests. To reach an overall conclusion, the probabilities for the 4 quarters were combined for each criterion separately utilizing the Fisher χ2 combined probability method.
The hypothermia QI project was reviewed by the institutional review board and determined to be exempt.
Results
The temperatures of 40 875 patients were available for analysis for the preintervention period between January 2016 and October 2018. The median percentage of patients with temperatures less than 36.0 °C was 6.9% (interquartile range [IQR], 5.8%-8.4%). The highest percentage was in February 2016 (9.9%), and the lowest was in March 2018 (3.4%). Following the start of the first PDSA cycle, the next 6 consecutive rates of hypothermia were below the median preintervention value, and a new median for these percentages was calculated at 3.4% (IQR, 2.6%-4.3%). In July 2019, the proportion of hypothermic patients decreased once more for 6 consecutive months, yielding a new median of 1.6% (IQR, 1.2%-1.8%) and again in July 2020, to yield a median of 1.3% (IQR, 1.2%-1.5%) (Figure). In all, 33 799 patients were analyzed after the start of the project from November 2018 to the end of the data collection period through April 2021.
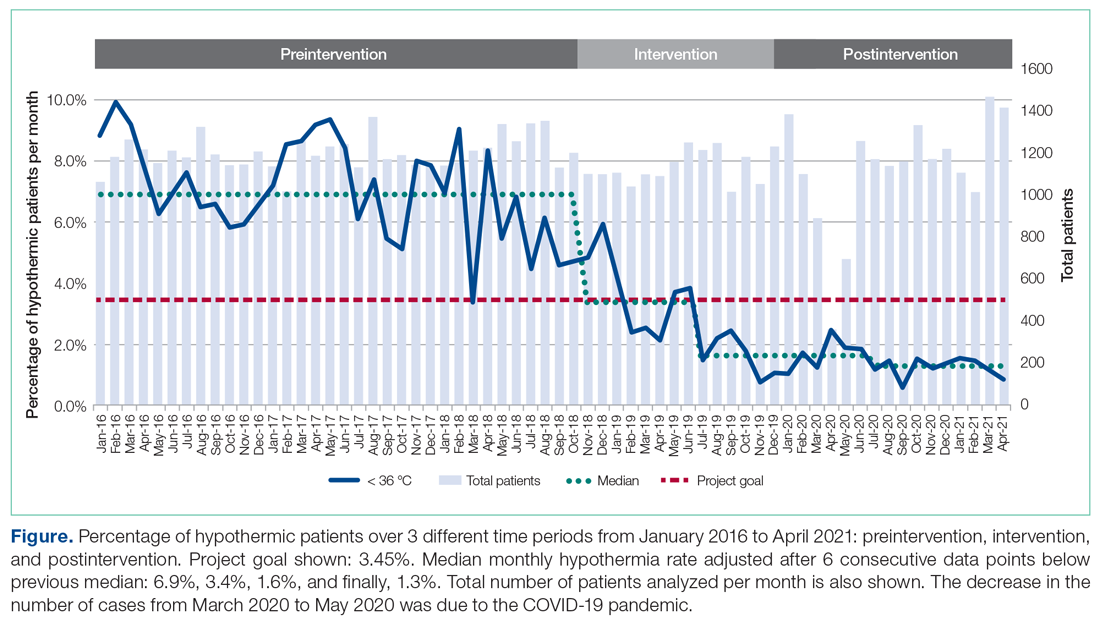
The preintervention monthly rates of hypothermia were compared, quarter to quarter, with those starting in November 2018 using the Wilcoxon Mann-Whitney U test. The decrease in proportion of hypothermic patients after the start of the intervention was statistically significant (P < .001). In addition, the percentage of patients with temperatures greater than 38 °C was not significantly different between the pre- and postintervention time periods (P < .25) (Table 2). The decrease in the number of patients available for analysis from March 2020 to May 2020 was due to the COVID-19 pandemic.
Subjectively, we did not experience any notable resistance to our efforts, and the experience was largely positive for everyone involved. Clinicians identified as having high monthly rates of hypothermia (5% or higher) corrected their numbers the following month after being notified via email or in person.