Results
Descriptive Statistics
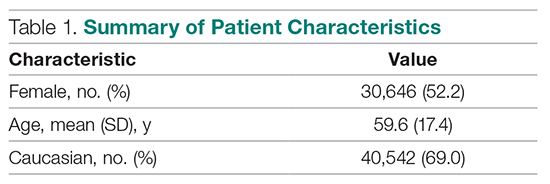
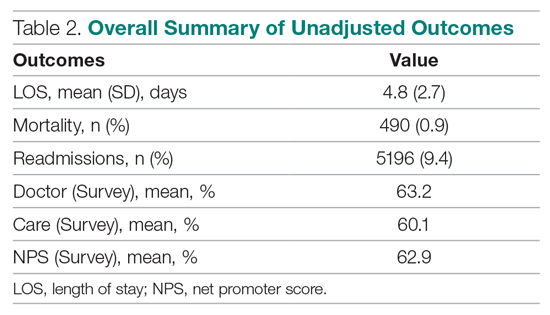
A total of 58,730 hospitalizations were included, of which care was provided by 963 unique providers across 25 acute care and critical access hospitals. Table 1 contains patient characteristics, and Table 2 depicts overall unadjusted outcomes. Providers responsible for less than 12 discharges in the calendar year were excluded from both approaches. Also, some hospitalizations were excluded when expected values were not available.
Multi-Membership Model Results
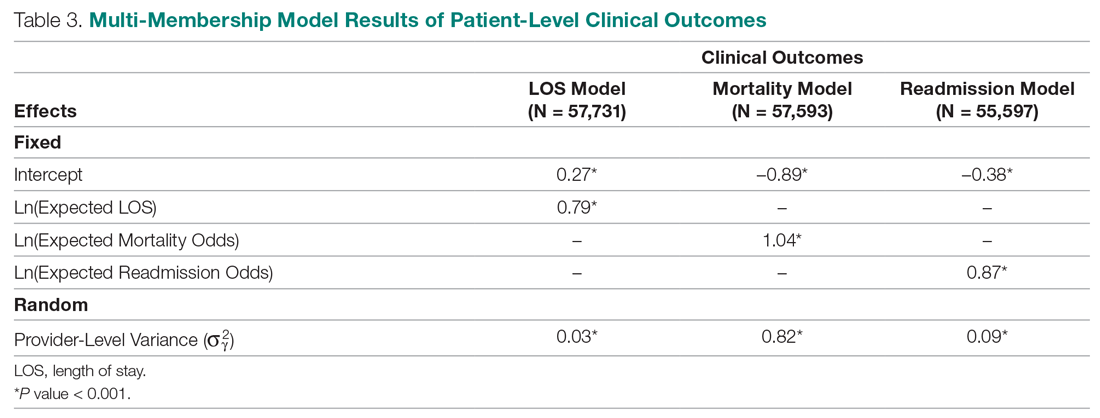
Table 3 displays the results after independently fitting MM models to each of the 3 clinical outcomes. Along with a marginal intercept, the only covariate in each model was the corresponding expected value after a transformation. This was added to use the same information that is typically used in OE indices, therefore allowing for a proper comparison between the 2 attribution methods. The provider-level variance represents the between-provider variation and measures the amount of influence providers have on the corresponding outcome after controlling for any covariates in the model. A provider-level variance of 0 would indicate that providers do not have any influence on the outcome. While the mortality and readmission model results can be compared to each other, the LOS model cannot given its different scale and transformation altogether.
The results in Table 3 suggest that each expected value covariate is highly correlated with its corresponding outcome, which is the anticipated conclusion given that they are constructed in this fashion. The estimated provider-level variances indicate that, after including an expected value in the model, providers have less of an influence on a patient’s LOS and likelihood of being readmitted. On the other hand, the results suggest that providers have much more influence on the likelihood of a patient dying in the hospital, even after controlling for an expected mortality covariate.
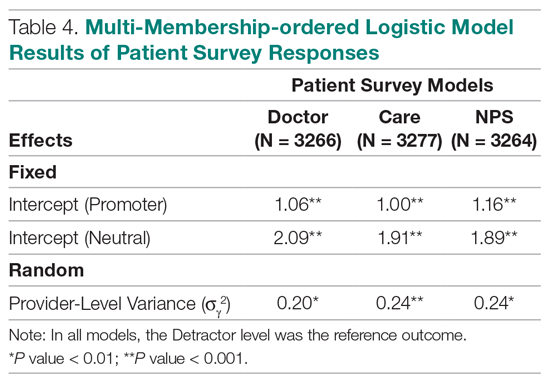
Table 4 shows the results after independently fitting MM-ordered logistic models to each of the 3 survey questions. The similar provider-level variances suggest that providers have the same influence on the patient’s perception of the quality of their interactions with the doctor (Doctor), the quality of the care they received (Care), and their likelihood to recommend a friend or family member to the hospital (NPS).
Comparison Results Between Both Attribution Methods
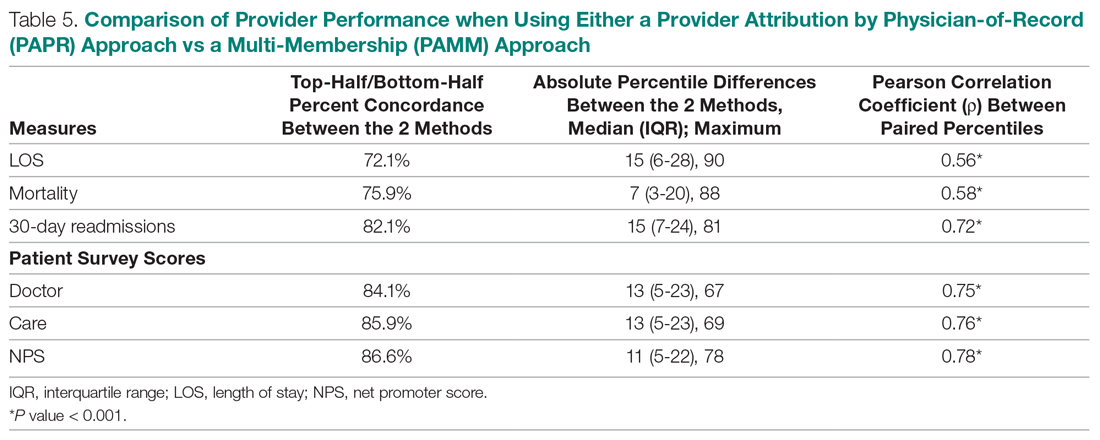
Table 5 compares the 2 attribution methods when ranking providers based on their performance on each outcome measure. The comparison metrics gauge how well the 2 methods agree overall (percent concordance), agree at the provider level (absolute percentile difference and interquartile range [IQR]), and how the paired percentiles linearly correlate to each other (Pearson correlation coefficient).
LOS, by a small margin, had the lowest concordance of clinical outcomes (72.1%), followed by mortality (75.9%) and readmissions (82.1%). Generally, the survey scores had higher percent concordance than the clinical outcome measures, with Doctor at 84.1%, Care at 85.9%, and NPS having the highest percent concordance at 86.6%. Given that by chance the percent concordance is expected to be 50%, there was notable discordance, especially with the clinical outcome measures. Using LOS performance as an example, one attribution methodology would rank a provider in the top half or bottom half, while the other attribution methodology would rank the same provider exactly the opposite way about 28% of the time.
The median absolute percentile difference between the 2 methods was more modest (between 7 and 15). Still, there were some providers whose performance ranking was heavily impacted by the attribution methodology that was used. This was especially true when evaluating performance for certain clinical measures, where the attribution method that was used could change the provider performance percentile by up to 90 levels.
The paired percentiles were positively correlated when ranking performance using any of the 6 measures. This suggests that both methodologies assess performance generally in the same direction, irrespective of the methodology and measure. We did not investigate more complex correlation measures and left this for future research.
It should be noted that ties occurred much more frequently with the PAPR method than when using PAMM and therefore required tie-breaking rules to be designed. Given the nature of OE indices, PAPR methodology is especially sensitive to ties whenever the measure includes counting the number of events (for example, mortality and readmissions) and whenever there are many providers with very few attributed patients. On the other hand, using the PAMM method is much more robust against ties given that the summation of all the weighted attributed outcomes will rarely result in ties, even with a nominal set of providers.

