Data Analysis
Data for all admissions from 2013 and 2016 were extracted from the organization’s computer system into an Excel file. The data collected included gender, calendar year of admission to the program, age, and diagnosis group based on the discharge diagnosis given by the mental health team, and whether the client was a participant in the Youth in Transition (YIT) program (program for older clients that includes life skills training in addition to standard therapy). The CASII composite rating at baseline and discharge as well as ratings for each of the 6 dimensions assessed with the CASII were also collected.
We used SPSS (v25.01) software for statistical analysis. Analysis included paired (pre-post) t-tests that were applied to the entire cohort as well as within gender, age group, participation in the YIT program, and diagnosis groups. Diagnosis groups were included only if the frequency of cases within the group was large enough to meet the sample size requirements of central limit theorem (in general, n > 25), with 2 exceptions: schizophrenia spectrum was included because of the rarity of the diagnosis (n = 11) and neurodevelopmental disorders (also n = 11) was included because there was no violation of the equal variance assumption as well as interest to the investigators. In addition to the paired analysis, we used group t tests to determine if there were severity differences between groups at baseline. Lastly, we assessed change from admission to discharge for each of the 6 dimensions that make up the composite rating.
We designated the 7 levels of care defined by the CASII as continuous in nature, and therefore computations of means and standard deviations (SD) are appropriate for assessment. The interpretation of the CASII composite rating and the level of care as a continuous variable has also been reported in the literature [11,12].
The research and analysis was viewed as exploratory in nature and a P value less than 0.05 was considered statistically significant. There was no correction for multiple comparisons applied to the data in order to not mask any observed differences in the data. All analyses were 2-tailed. If any individual had a missing value for either an admission or discharge CASII assessment they were excluded from the statistical analysis.
Results
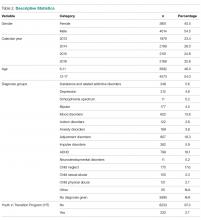
There were 8465 clients admitted from 2013 and 2016. The sample was predominantly male (54.5%), and the majority fell into the older 12–17 year old cohort (54.0%). Admissions were evenly distributed across the 4 years that we studied, with the lowest percentage in 2013 at 23.4% and the highest in 2014 at 26.0%. Discharge diagnosis was available for the majority of the cohort. The top 5 most frequent diagnosis groups were adjustment disorders (n = 807, 18.3%), ADHD (n = 798, 18.1%), child neglect (n = 775, 17.6%), mood disorders (n = 602, 13.6%), and impulse disorders (n = 262, 5.9%). There were 232 (2.7%) clients that participated in the YIT program. Table 2
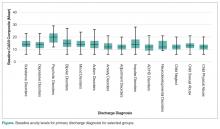
presents the demographic data for the cohort.At admission, several groups had higher mean composite ratings. Males had higher ratings (in need of higher level of service intensity) than females (P < 0.001), 12–17 year olds had a significantly higher acuity level than 6–11 year olds (P < 0.001), and clients in the YIT program had a higher acuity level than those not in the YIT program (P = 0.001). Baseline acuity levels for primary discharge diagnosis for selected groups are shown in the Figure.
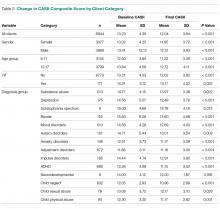
When analyzing the entire cohort for which data were available (n = 6944), the mean CASII composite rating dropped from 13.23 (± 4.35 SD) to 12.04 (± 3.84 SD), P < 0.001. Excluding youth that participated in YIT, the mean CASII score dropped from 13.21 (± 4.33) at admission to 13.17 (± 4.52) at discharge. Mean composite rating for clients participating in the YIT program dropped from 14.31 (± 5.12) at admission to 13.17 (± 4.52) at discharge (P = 0.022). For diagnosis groups, statistically significant reduction in mean CASII composite rating was observed for all groups except neurodevelopmentall disorders (P = 0.166). The results for all groups and diagnosis cohorts can be found in Table 3.
As noted, the CASII assesses the client across 6 dimensions, each of which is scored along a 5-point rating scale, and the composite rating is calculated by adding the scores for each dimension. Table 4 shows the change in mean dimension scores from baseline to discharge for these dimensions. Mean scores improved significantly (all P < 0.001).
Highest acuity on admission was for the Recovery Environment – Stress dimension (2.46 ± 0.757), which improved to 2.05 ± 0.796 on discharge. Table 5 shows the percentage of clients whose dimension scores decreased, increased, or stayed the same. The greatest decrease was for Recovery Environment – Stress, where 43.2% of clients had a lower score at discharge, followed by Functional Status (35.8%) and Resiliency/Response to Service at 30.7%. Level of care decreased for 28.7% of the cohort, increased for 21.7% , and stayed the same for 49.6% (P < 0.001).


