Outcome Measures
The main outcome measure was the frequency of sustained (≥ 6 hours) high surges, a marker of inability to respond effectively. High surges were defined as Moderate and Major surges combined. Our expert group consensus was that combinging the Moderate and Major surge categories to represent “high” surge was reasonable since they both require mobilizing resources on a hospital-wide level, and failure to improve despite 6 continuous hours of actively trying to address such high surges would lead to significantly higher risk for quality of care and patient safety issues.
Secondary outcomes include overall frequency of reaching high surge levels at various components of the Input-Throughput-Output ED flow model, hospital occupancy levels, and care facilitators’ perceptions on workload and overall effectiveness of the surge protocol.
Results
ED Flow
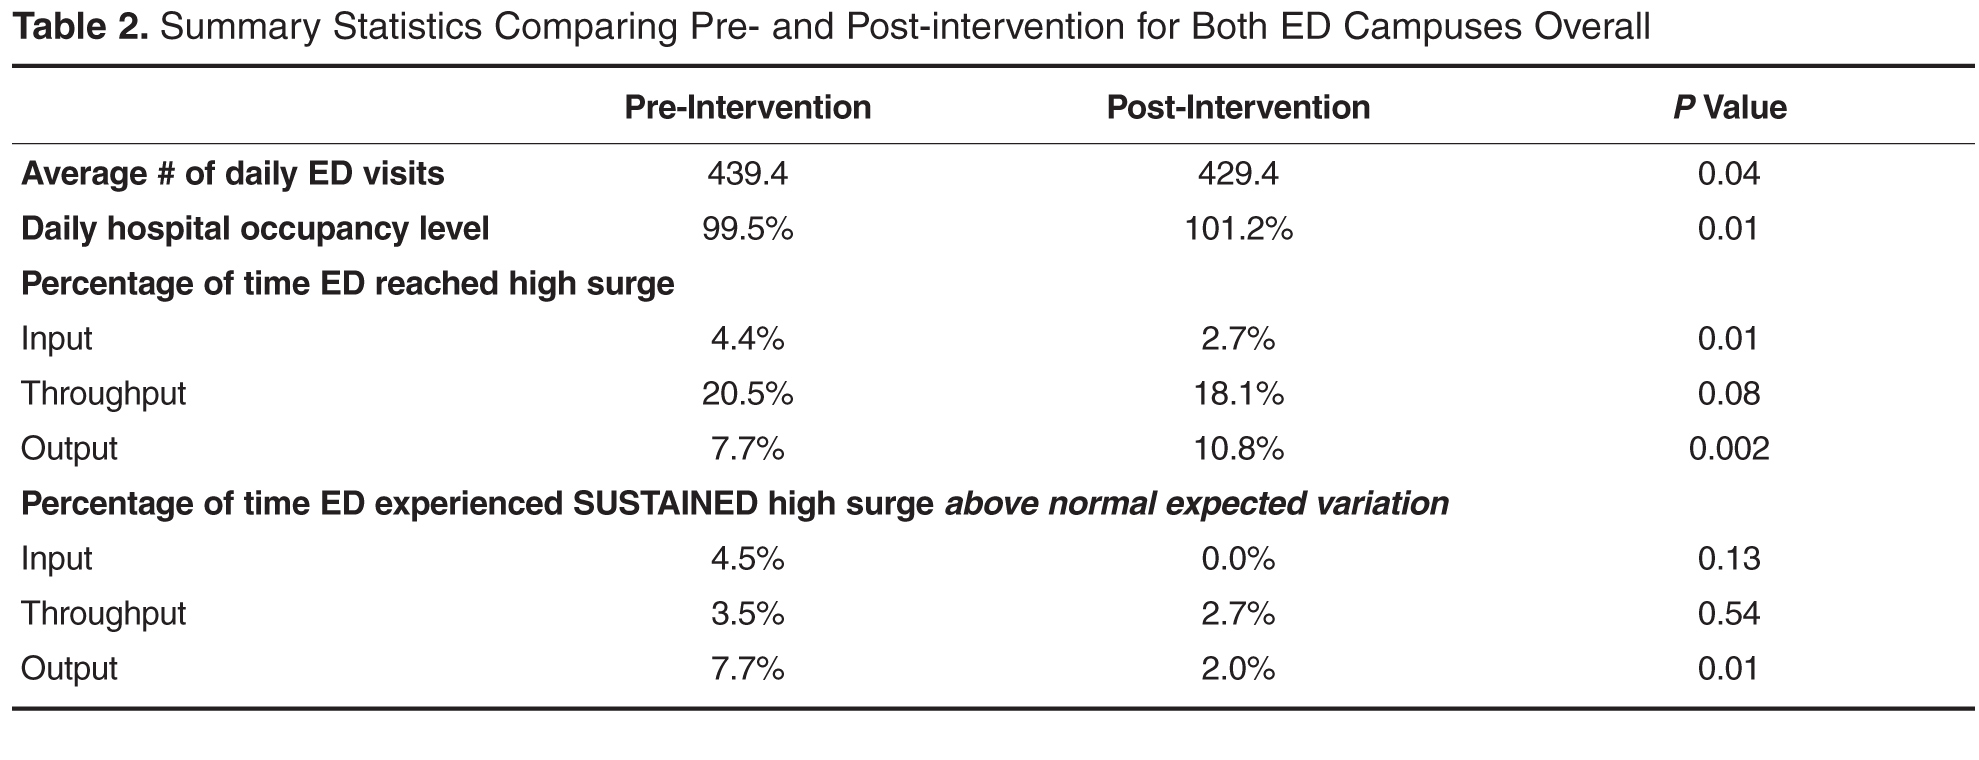
Table 2 presents the summary statistics for both campuses comparing the pre- and post-implementation time periods. During the study period, the average number of daily ED visits decreased slightly by 10 patients per day (pre 439.4, post 429.4, P = 0.04), while the average daily hospital occupancy levels steadily rose above 100% (pre 99.5%, post 101.2%, P = 0.01). Despite rising hospital occupancy levels, the proportion of time the ED reached high surge levels decreased for Input (pre 4.4%, post 2.7%, P = 0.01) and Throughput (pre 20.5%, post 18.1%, P = 0.08) components of ED flow after implementation. The frequency of high surges in the Output component did significantly increase (pre 7.7%, post 10.8%, P = 0.002).
Statistical Process Control Charts
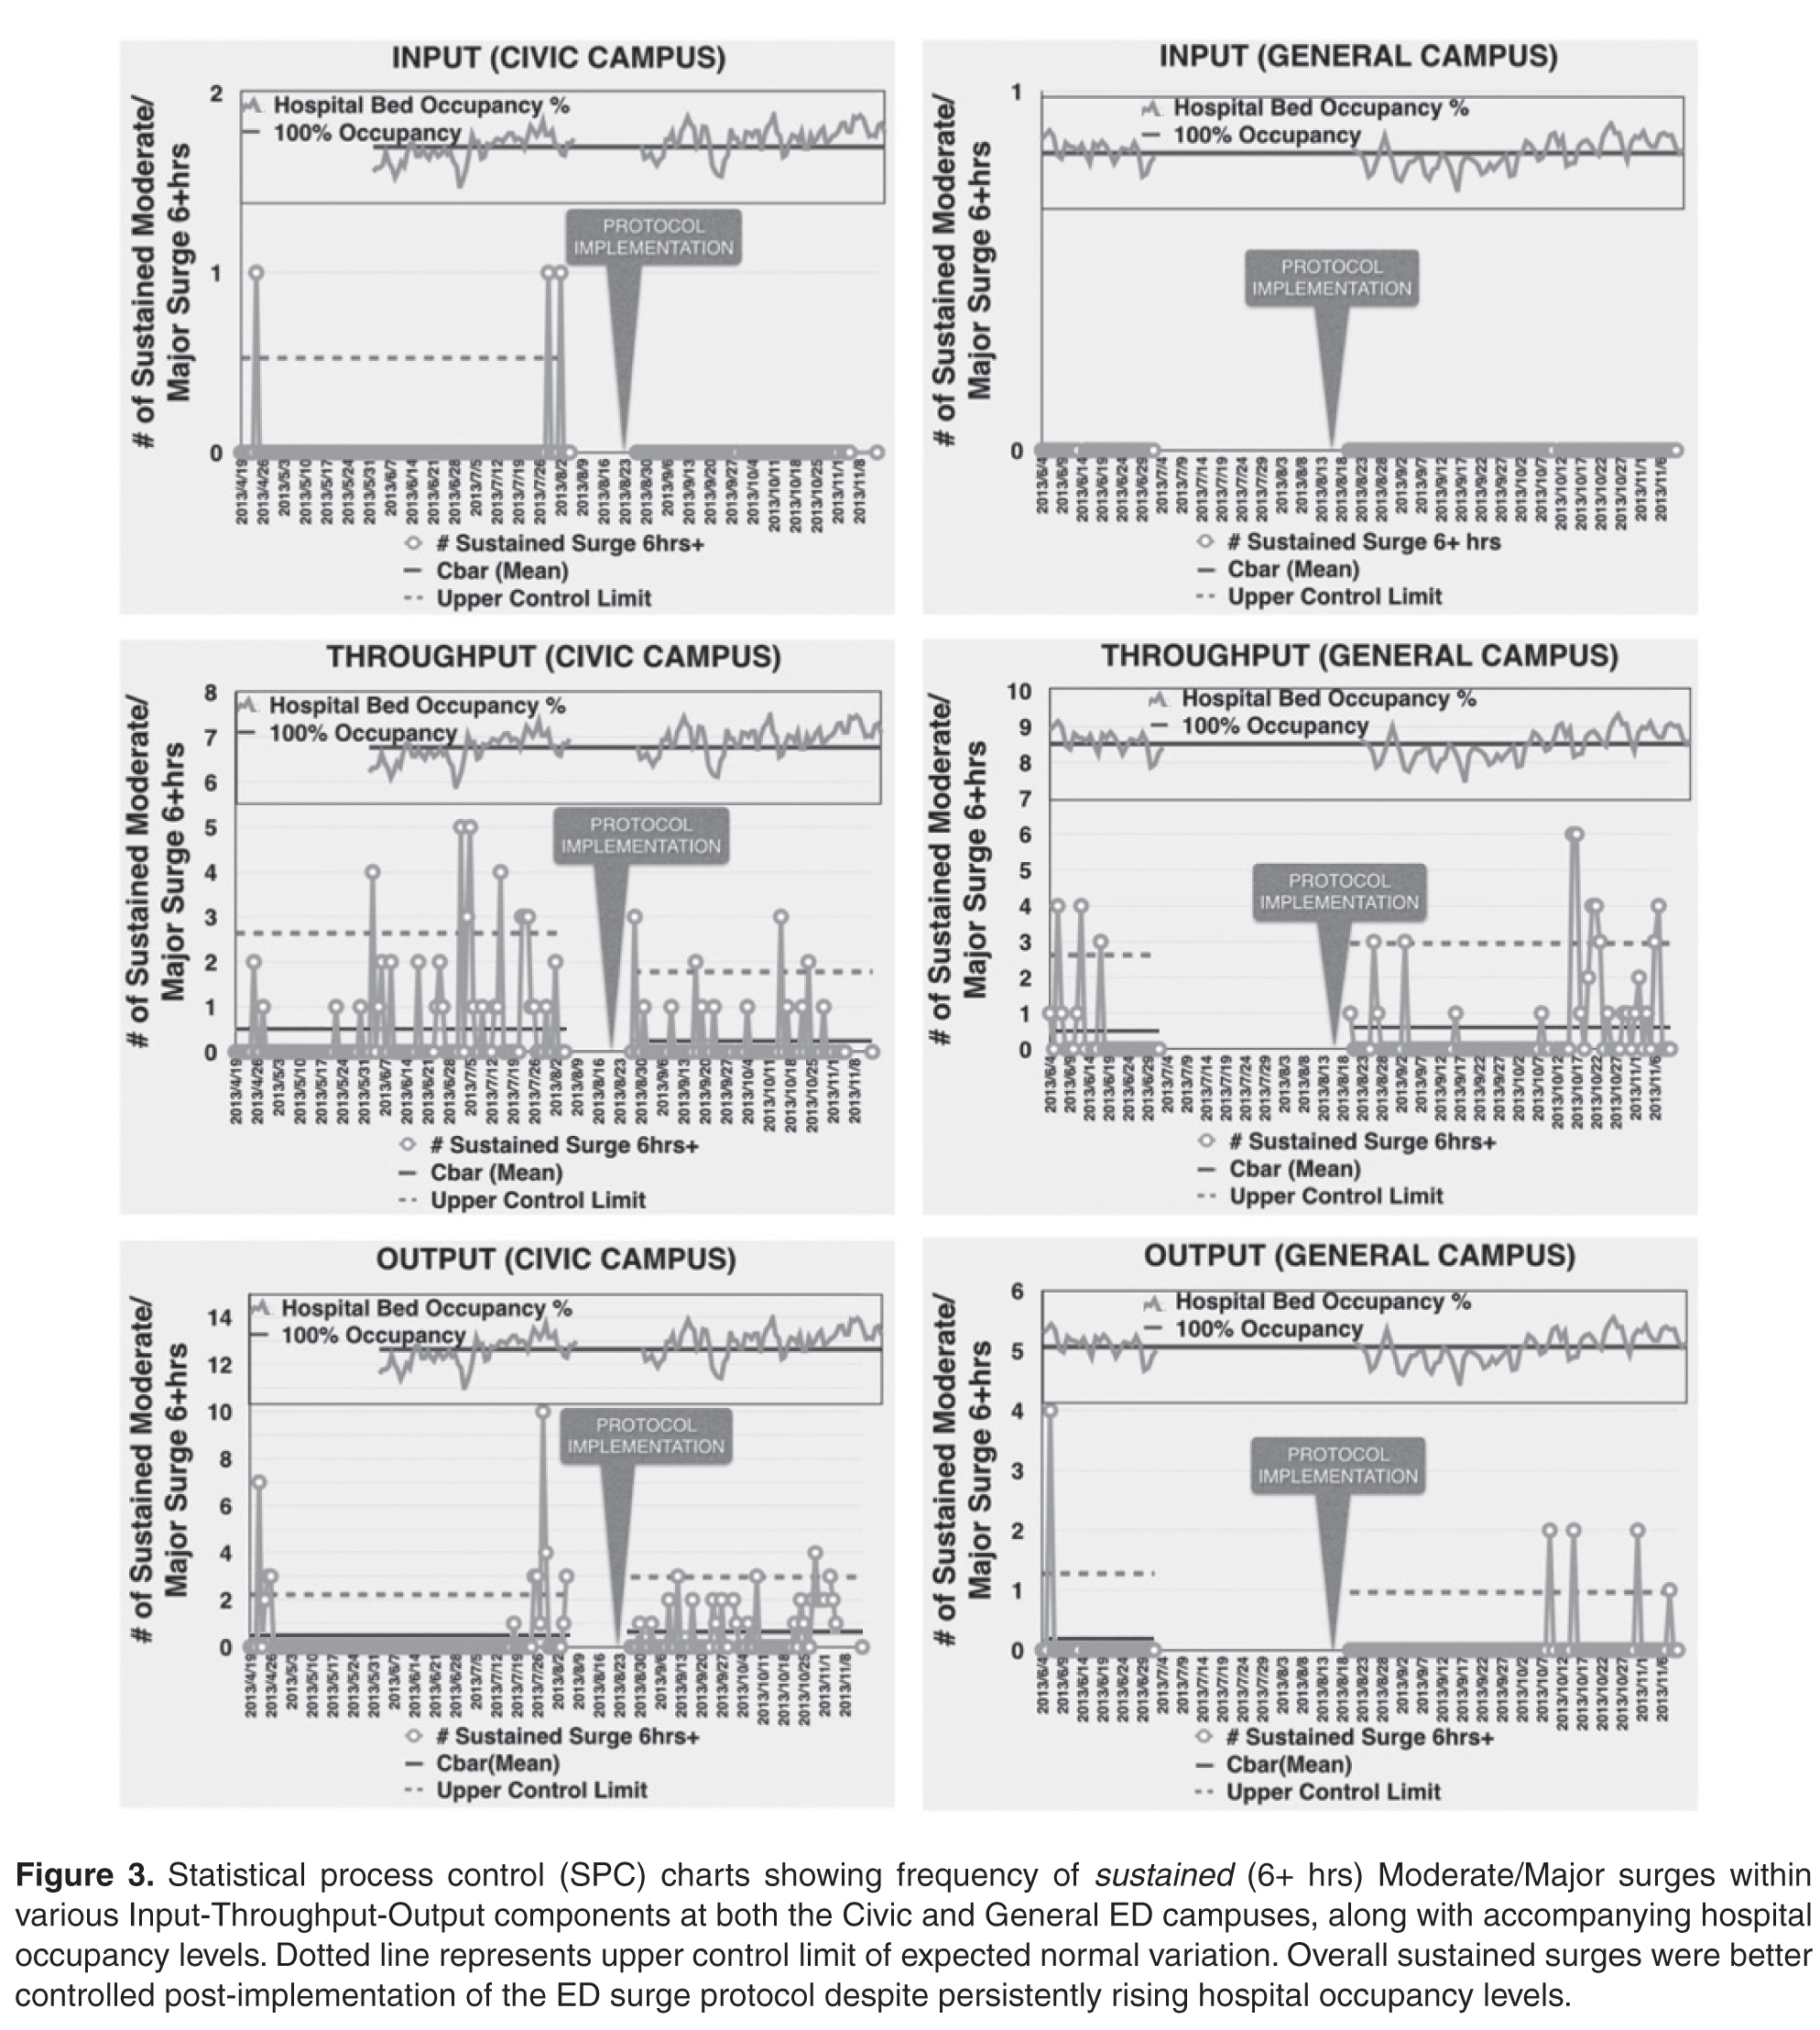
Figure 3 shows SPC charts for the different Input-Throughput-Output components of the 2 different ED campuses over the study period. Daily frequency of sustained high surges lasting 6 or more consecutive hours were plotted along with hospital occupancy levels. The number of times data points rose above the upper limit of the SPC chart (ie, above normal expected variation) pre- and post-intervention were used for statistical comparison. Overall for the 2 campuses combined, the frequency of sustained high surges above normal variation remained stable for Input and Throughput (pre 4.5%, post 0.0%, P = 0.13; pre 3.5%, post 2.7% , P = 0.54) components of the ED flow model, respectively. More importantly, the frequency of sustained high surges in the Output component decreased, reaching statistical significance [pre:7.7% vs post:2.0% , P = 0.01], despite a rise in the total number of times the ED reached severe Output surges and overall hospital occupant levels.
Survey of Care Facilitators
The primary users and drivers of the surge protocol—the care facilitator group—felt strongly that the tool was easy to use and that it made a positive difference. 72% felt that the ED surge protocol has increased their workload but 92% felt that it was good for overall flow of the ED. Specific feedback included having a much more standardized language around communicating (and acting on) surges, and a better overall bird’s-eye view of the department.
Discussion
Despite a call for urgent research on implementing solutions targeting daily ED surges (vs. global ED crowding) over a decade ago at the Academic Emergency Medicine 2006 Consensus Conference [12], little work has been published on distinguishing, measuring, and dealing with ED surges. McCarthy et al proposed the rate of patient arrivals to the ED by time of day as a rudimentary definition of surge, although they provided very little specific guidance on what to do with that information in the setting of responding to spikes in surges [13]. Asplin et al described a number of theoretical models to bridge ED census, daily surges, length of stay and quality of care, however they were never validated in real-life scenarios [14]. A systematic review published in 2009 summarizing articles that described theoretical and practical ED surge responses found a large heterogeneity of different proposed models with little standardization and multiple shortcomings [15].