Analysis
Univariate analyses including t tests and chi-square tests were conducted to investigate the unadjusted association between variables and glycemic control. Good glycemic control was defined as 90% of all POC blood glucose tests between 70 and 180 mg/dL based on empirical distribution and organization targets. A predictive model of inpatient glycemic control was then developed using a backward stepwise multivariable logistic regression approach. The data were split into a model building and validation set. Variables were included that represented both baseline and transitional state during the hospital stay to account for potentially mediating effects and a sensitivity analysis was conducted with them in and out of the final model to assess impact. Standardized coefficients were calculated to rank order variables in the model allowing indication of the variables with the greatest predictive impact on the outcome. Further investigation of the optimal classification points for the variables was conducted to indicate best differentiation of good glycemic control. Significant variables from the multivariable logistic regression were included in an exploratory classification tree analysis that recursively partitioned data in order to improve the fit, with optimal splitting identified over all variables at all possible split points. Classification tree cut-off points were used to further develop models identifying odds ratios for various thresholds for the top three predictive variables. A series of logistic regression models were then run with differing cut points of top 3 predictors to isolate adjusted odds of good glycemic control. Analytic data set building and statistical analyses were completed using SAS 9.4.
Results
Patient Characteristics
Table 1 shows patient demographic and clinical characteristics for the entire sample and for the top quartile (76% or greater POC blood glucose values within target range) and bottom quartile (25% or less POC blood glucose values within target range). Unadjusted results show a significant difference across quartiles for all factors except age, gender, dementia, rheumatic disease and paraplegia. Patients in the bottom 25th percentile (ie, the poorest control) were more likely than the total population to have a higher admission blood glucose (198 mg/dL vs. 153 mg/dL), higher HbA1c (8.53 [70mmol/mol] vs. 7.35 [57mmol/mol), a medical (74% vs. 66%) and/or respiratory (18% vs. 12%) diagnosis, corticosteroid use (17% vs. 27%), an insulin order set use (80% vs. 70%) and higher mean blood glucose during hospitalization (206.3 vs. 157.1 mg/dL). Patients with poorest control were less likely that the total population to have a high risk of mortality (11% vs. 15%) and severity of illness (13% vs. 18%). They also had less ICU care (8% vs. 13%), and a shorter LOS (5.82 vs. 7.82 days).
Predictive Modeling
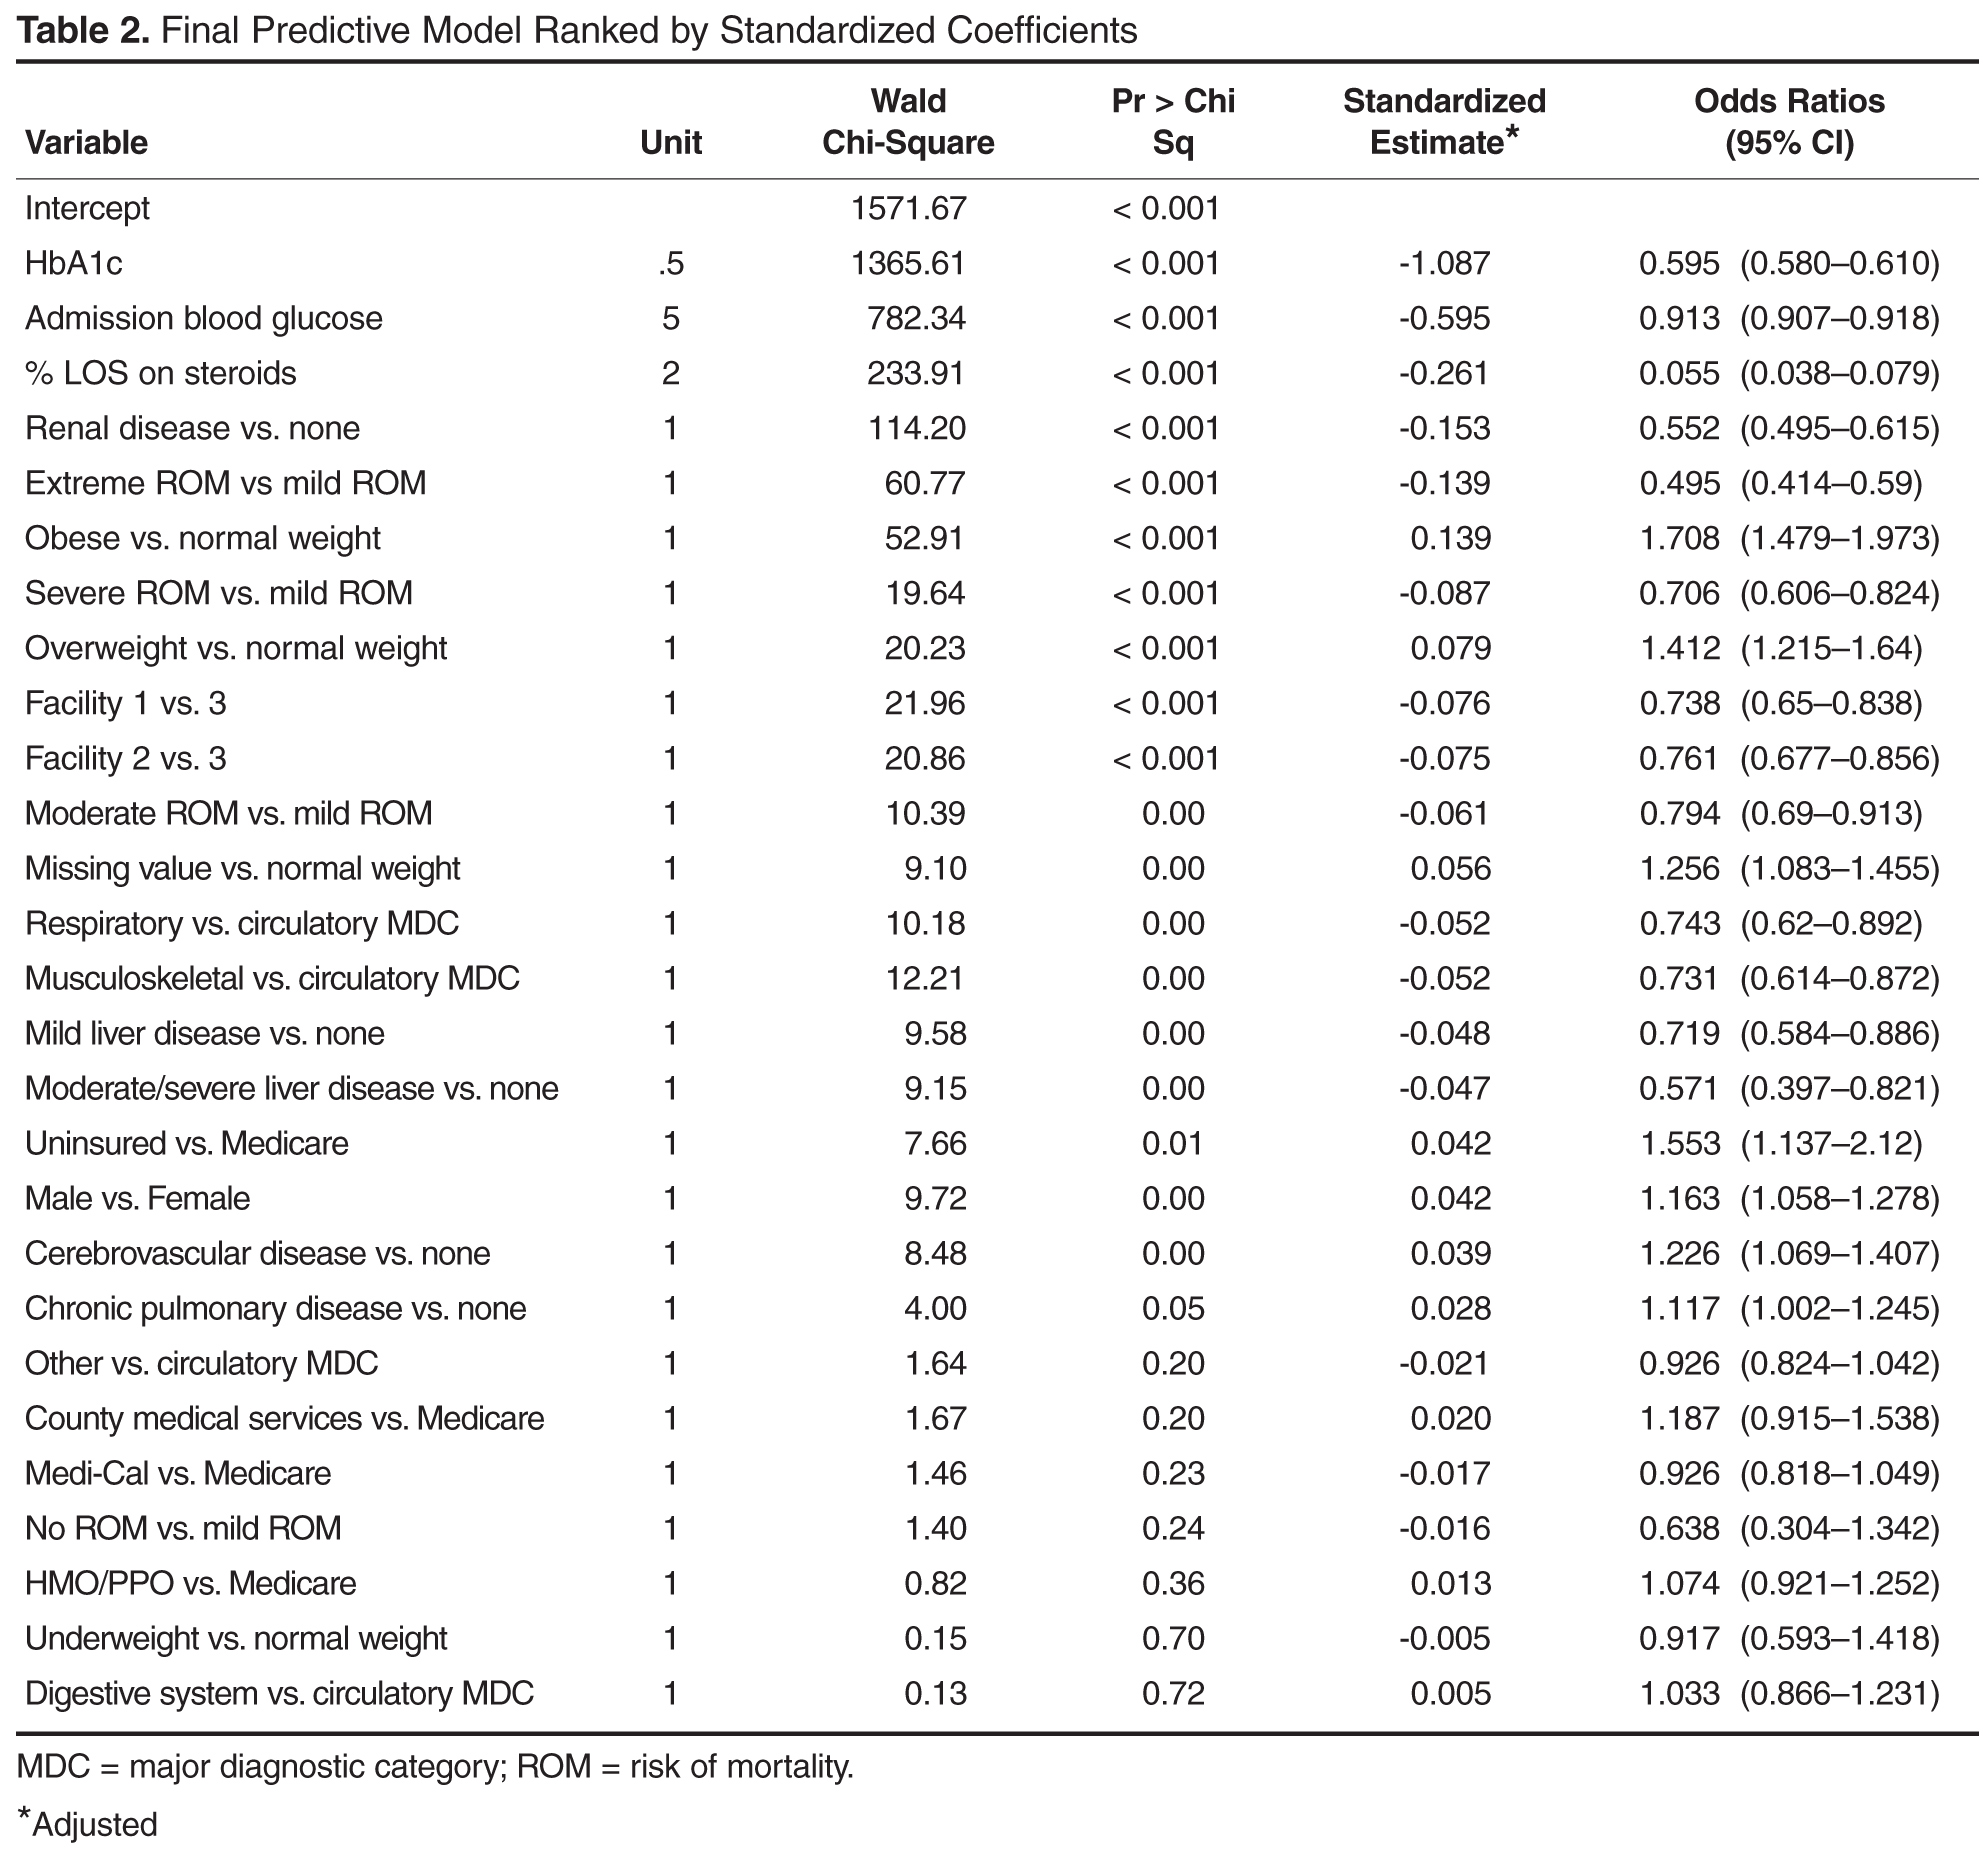
Classification tree analysis resulted in the same top 3 predictors, but in a different order. The analysis also provided cut-off values that predict suboptimal glycemic control. Classification tree analysis showed admission blood glucose was the most influential predictor, with 164.5 mg/dL indicating the optimal cut-point for prediction of SGC, followed by HbA1c with an optimal cut-off point of 6.65% indicating prediction of SGC, followed by treatment with corticosteroids, with an optimal cut-off point of 24% of the LOS on corticosteroids indicating prediction of SGC.