Statistics
For this analysis, the 2 positive sentiment responses (agree and completely agree) and the 2 negative sentiment responses (disagree and completely disagree) in the Likert scale were collapsed into single categories (good and poor, respectively). The neither agree nor disagree responses were coded as neutral. Our analysis began with a visual exploration of all variables to evaluate the frequency, percentage, and near-zero variance for categorical variables.14 Near-zero variance occurs when a categorical variable has a low frequency of unique values over the sample size (ie, the variable is almost constant), and we addressed it by combining different variable categorizations. We handled missing values through imputation algorithms followed by sensitivity analyses to verify whether our results were stable with and without imputation. We performed comparisons for the exploratory analysis using P values for one-way analysis of variance tests for numeric variables and χ2 tests for categorical variables. We considered P values < .05 to be statistically significant. We also used correlation matrices and plots as exploratory analysis tools to better understand all items’ correlations. We used Pearson, polychoric, and polyserial correlation tests as appropriate for numeric, ordinal, and logical items.
Our modeling strategy involved a series of generalized linear models (GLMs) with a Gaussian family, ie, multiple linear regression models, to assess the association between (1) facilities’ preferences regarding pre-anesthesia evaluation modalities; (2) advantages between modalities; and (3) barriers to the adoption of telehealth and the ability to perform different pre-anesthesia evaluation-related tasks. In addition, we used backward deletion to reach the most parsimonious model based on a series of likelihood-ratio tests comparing nested models. Results are reported as predicted means with 95% confidence intervals, with results being interpreted as significant when any 2 predicted means do not overlap between different estimates along with P for trends < .001. We performed all analyses using the R language.15
Results
Of 109 surveyed facilities, 50 (46%) responded to the survey. The final study sample included 67 responses, and 55 were included in the analysis. Twelve responses were excluded from the analysis as they were either incomplete or test responses. Three facilities had > 1 complete response (2 facilities had 2 responses and 1 facility had 4 responses), and these were all included in the analysis.
Thirty-six locations were complex inpatient facilities, and 32 (89%) had pre-anesthesia evaluation clinics (Table 1).
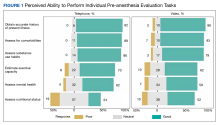
Twenty-two facilities reported using both telephone and video, 11 telephone only, 5 video only, and 12 neither. Considering the 55 individual responses, 25 respondents reported using both telephone and video, 12 reported using telephone only, 5 using video only, and 13 reported using neither telephone nor video for pre-anesthesia evaluations.The ability to obtain a history of present illness was rated good/very good via telephone for 34 respondents (92%) and 25 for video (86%). Assessing comorbidities and health habits was rated good/very good via telephone for 32 respondents (89%) and 31 respondents (86%), respectively, and via video for 24 respondents (83%) and 23 respondents (79%), respectively (Figure 1).
Fewer respondents rated the ability to estimate exercise capacity or mental health pathology good/very good: 26 respondents (70%) and 23 respondents (62%) for telephone, respectively, and 18 (62%) and 17 (59%) for video, respectively. The ability to assess nutritional status was rated lowest with 9 respondents (24%) rating it positively for telephone and 15 (52%) for video.To compare differences between the 2 remote pre-anesthesia evaluation modalities, we created GLMs evaluating the association between each modality and the perceived ability to perform the tasks. For GLMs, we transformed the values of the categories into numerical (ie, 1, poor; 2, neutral; 3, good). Compared with telephone, video was rated more favorably regarding the assessment of nutritional status (mean, 2.1; 95% CI, 1.8-2.3 vs mean, 2.4; 95% CI, 2.2-2.7; P = .04) (eAppendix 1, available at doi:10.12788/fp.0387). No other significant differences in ratings existed between the 2 remote pre-anesthesia evaluation modalities.
The most significant barriers (cited as significant or very significant in the survey) included the inability to perform a physical examination, which was noted by 13 respondents (72%) and 15 respondents (60%) for telephone and video, respectively. The inability to obtain vital signs was rated as a significant barrier for telephone by 12 respondents (67%) and for video by 15 respondents (60%)(Figure 2).
Other less-cited barriers included concerns about patient safety and risk; patient preference; cultural barriers; lack of support from staff; and lack of evidence for its effectiveness. Specific to video care, patients’ lack of access to a computer was cited as a barrier by 12 respondents (48%), whereas only 3 (17%) cited lack of telephone as a barrier. Lastly, lack of information technology support was cited as a barrier for video visits by 8 respondents (32%). To determine differences in perceived barriers to the implementation of phone vs video pre-anesthesia evaluations, we created GLM evaluating the association between these 2 modalities and the perceived ability to perform commonly performed pre-anesthesia evaluation visit tasks. For GLM, again we transformed the values of the categories into numeric (ie, not a significant barrier, 1; somewhat a barrier, 2; a significant barrier, 3). There were no significant differences in ratings between the 2 remote pre-anesthesia evaluation modalities (eAppendix 2, available at doi:10.12788/fp.0387).The average FIM score was 3.7, with the highest score among respondents who used both phone and video (Table 2). The average AIM score was 3.4, with the highest score among respondents who used both telehealth modalities. The internal consistency of the implementation measures was excellent (Cronbach’s α 0.95 and 0.975 for FIM and AIM, respectively).


