For the 1-year survival outcome, the primary dependent variable, we queried the vital status files in the CDW for the date of death if applicable. We confirmed survival beyond 1 year by examining vital signs in the CDW for a minimum of 2 independent encounters beyond 1 year after the date of discharge. To compute the index LOS, the secondary outcome, we computed the difference between the date of admission and date of hospital discharge.
Statistical Methods
The parameters and performance of the multivariable logistic regression models developed to compute the various CAN mortality and hospitalization risk scores have been previously described.12 Briefly, Wang and colleagues created parsimonious regression models using backward selection. Model discrimination was evaluated using C (concordance)-statistic. Model calibration was assessed by comparing predicted vs observed event rates by risk deciles and performing Cox proportional hazards regression.
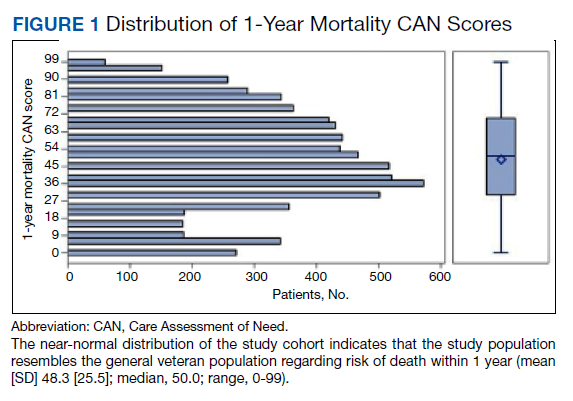
We plotted histograms to display preoperative CAN scores as a simple measure of distribution (Figure 1). We also examined the cumulative proportion of patients at each preoperative CAN 1-year mortality score.
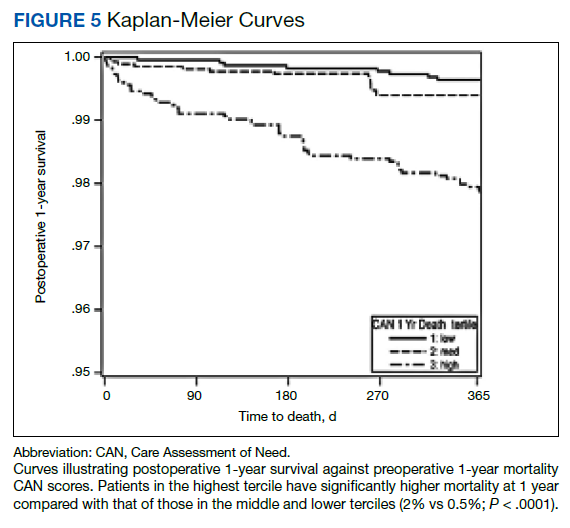
Using a conventional t test, we compared means of preoperative CAN 1-year mortality scores in patients who survived vs those who died within 1 year. We also constructed a plot of the proportion of patients who had died within 1 year vs preoperative CAN 1-year mortality scores. Kaplan-Meier curves were then constructed examining 1-year survival by CAN 1-year mortality score by terciles.
Finally, we examined the relationship between preoperative CAN 1-year mortality scores and index LOS in 2 ways: We plotted LOS across CAN scores, and we constructed a locally weighted regression and smoothing scatterplot. LOESS (locally weighted polynomial regression) models, involve fitting the polynomial using weighted least squares, giving more weight to points near the point whose response is being estimated and less weight to points further away. LOESS models help fit a smooth curve to data for which linear and nonlinear least squares regression models do not perform well and in situations where no theoretical model exists. LOESS are ideal for modeling complex processes. All analyses were performed using SAS, version 9.3.
Results
We identified 8206 patients who had undergone a TKR over the 18-month study period. The overall mean (SD) for age was 65 (8.41) years; 93% were male, and 78% were White veterans. Patient demographics are well described in a previous publication.16,17
In terms of model parameters for the CAN score models, C-statistics for the 90-day outcome models were as follows: 0.833 for the model predicting hospitalization (95% CI, 0.832-0.834); 0.865 for the model predicting death (95% CI, 0.863-0.876); and 0.811 for the model predicting either event (95% CI, 0.810-0.812). C-statistics for the 1-year outcome models were 0.809 for the model predicting hospitalization (95% CI, 0.808-0.810); 0.851 for the model predicting death (95% CI, 0.849-0.852); and 0.787 for the model predicting either event (95% CI, 0.786-0.787). Models were well calibrated with α = 0 and β = 1, demonstrating strong agreement between observed and predicted event rates.
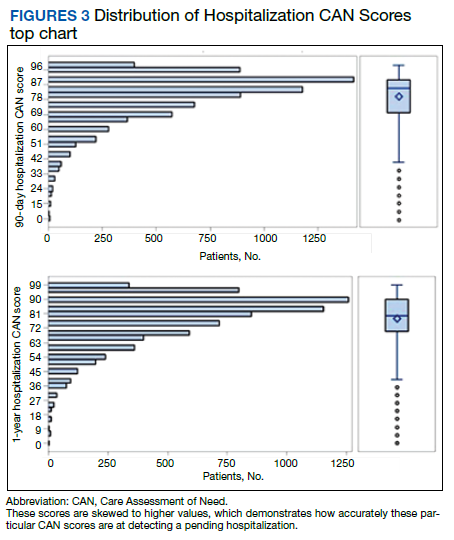
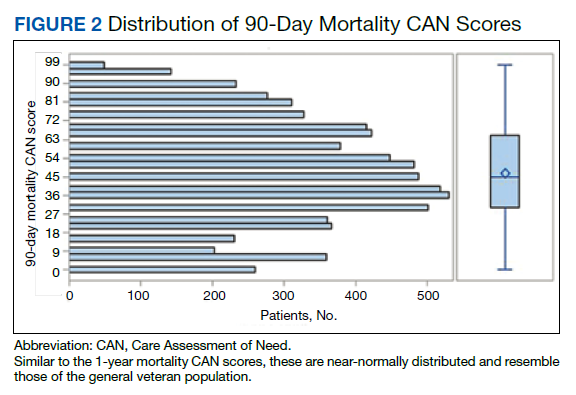
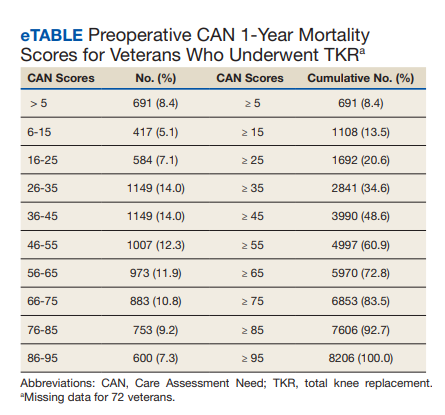
The distribution of preoperative CAN 1-year mortality scores was close to normal (median, 50; interquartile range, 40; mean [SD] 48 [25.6]) (eTable). The original CAN score models were developed having an equal number of patients in each strata and as such, are normally distributed.12 Our cohort was similar in pattern of distribution. Distributions of the remaining preoperative CAN scores (90-day mortality, 1-year hospitalization, 90-day hospitalization) are shown in Figures 2, 3, and 4. Not surprisingly, histograms for both 90-day and 1-year hospitalization were skewed toward higher scores, indicating that these patients were expected to be hospitalized in the near future.
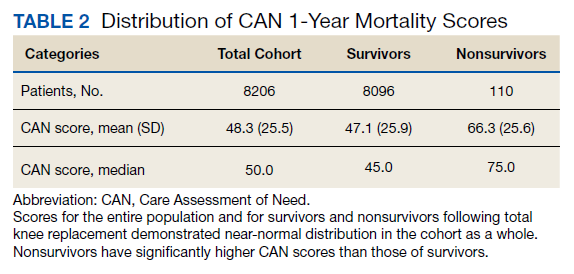
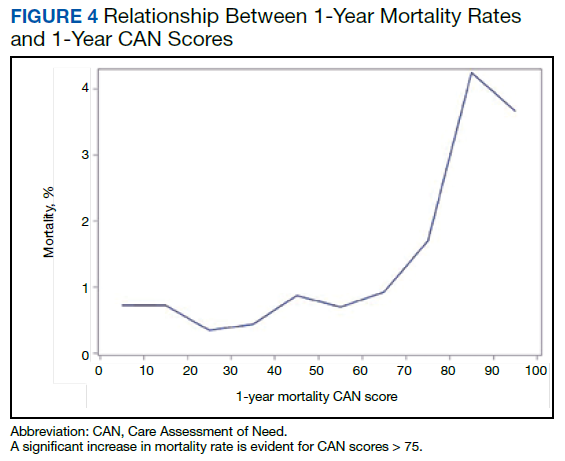
Overall, 1.4% (110/8096) of patients died within 1 year of surgery. Comparing 1-year mortality CAN scores in survivors vs nonsurvivors, we found statistically significant differences in means (47 vs 66 respectively, P < .001) and medians (45 vs 75 respectively, P < .001) (Table 2). In the plot examining the relationship between preoperative 1-year mortality CAN scores and 1-year mortality, the percentage who died within 1 year increased initially for patients with CAN scores > 60 and again exponentially for patients with CAN scores > 80. Examining Kaplan-Meier curves, we found that survivors and nonsurvivors separated early after surgery, and the differences between the top tercile and the middle/lower terciles were statistically significant (P < .001). Mortality rates were about 0.5% in the lower and middle terciles but about 2% in the upper tercile (Figure 5).
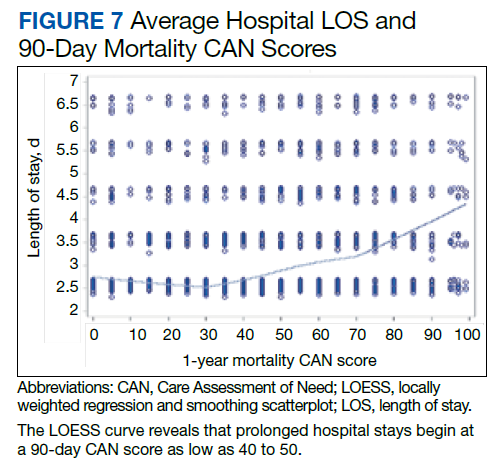
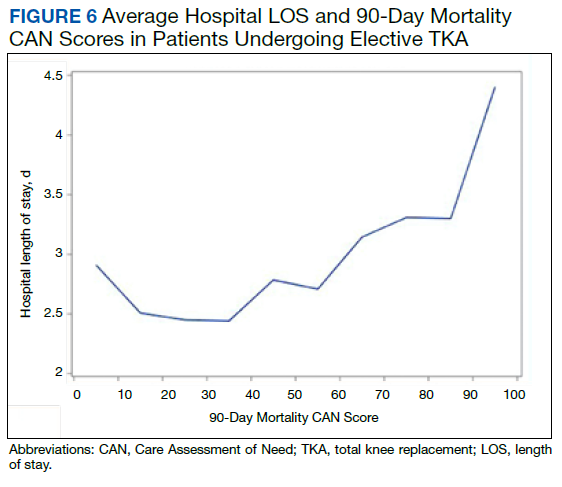
In the plot examining the relationship between CAN scores and index LOS, the LOS rose significantly beyond a CAN score of 60 and dramatically beyond a CAN score of 80 (Figure 6). LOESS curves also showed 2 inflection points suggesting an incremental and sequential rise in the LOS with increasing CAN scores (Figure 7). Mean (SD) LOS in days for the lowest to highest terciles was 2.6 (1.7), 2.8 (2.1), and 3.6 (2.2), respectively.