Homogeneity
All groups across all included studies were similar at baseline. All patients had mild to severe osteoarthritis of the knee. Mean ages of the groups were similar (treatment groups=67.1 years, placebo=66.7 years). Not all patients received treatment as per manufacturer’s recommendations ( TABLES 1 AND 2 ). A saline placebo was used for control groups in all studies. The volume of saline placebo for each study was equal to volume of hyaluronic acid injection plus saline vehicle used for that study. All studies used either the WOMAC scale or the Lequesne Functional Index as an outcome measurement tool. All studies included a follow-up outcome measurement; however, the range of follow-up time periods was wide (4 to 52 weeks).
Meta-analysis
The analysis for the outcome measurements on the WOMAC scale revealed no significant difference between groups in regards to pain or disability (95% confidence interval [CI] for pain, –0.6043 to 5.4755; for disability, –0.8282 to 4.8619). The outcome measurement for stiffness demonstrated a significant difference between treatment and control (95% CI for stiffness, 2.1780 to 8.7955).
The analysis for the outcome measurement on the Lequesne index revealed a significant difference between groups for measurements taken up to 6 months post-treatment (95% CI, 1.2315 to 2.6268). However, these differences were not seen in the 6+ month outcomes analysis (95% CI, –.8489 to .04787]. Confidence intervals are presented in FIGURE 1 . Mean differences for each outcome at baseline and post-treatment between the active treatment and placebo are presented in TABLE 3 .
TABLE 1
Hyaluronic acid: Manufacturer’s recommendations
| HA BRAND | ARTZAL | SYNVISC | HYALGAN | DUROLANE | SUPLASYN | NRD101 |
|---|---|---|---|---|---|---|
| Number of injections (given 1 week apart) | 5 | 3 | 5 | 1 | 3 | N/A |
| Concomitant local anesthetic injection recommended | Yes | No* | Yes | NR | N/A | N/A |
| Aspiration recommended prior to injection | Yes | Yes | Yes | Yes | No | N/A |
| Dosage per injection (mg) | 25.0 | 32.0 | 40.0 | 60.0 | 20.0 | 25.0 |
| Molecular weight (kDa) | 620–1170 | 6000 | 500–730 | N/A | N/A | 1900 |
| Cross-linked | No | Yes | No | Yes | No | N/A |
| HA, hyaluronic acid; NR, not reported; N/A, not available. | ||||||
| * Purported to alter the efficacy of Synvisc. | ||||||
TABLE 2
Details of included studies
| STUDY | KARLSSON ET AL7 | DOUGADOS ET AL8 | HUSKISSON9 | DAY ET AL16 | ALTMAN ET AL17 | PETRELLA ET AL18 | PHAM ET AL19 | |
|---|---|---|---|---|---|---|---|---|
| Brand | Artzal | Synvisc | Hyalgan | Hyalgan | Artzal | Durolane | Suplasyn | NRD101 |
| Number of injections | ||||||||
| given 1 wk apart | 3 | 3 | 4 | 5 | 5 | 1 | 3 | 3* |
| Mfr’s recommendations | 5 | 3 | 5 | 5 | 5 | 1 | 3 | NA |
| Concomitant local anaesthetic injection | NR | NR | NR | NR | Yes | NR | NR | Yes |
| Aspiration prior to injection | NR | NR | Yes | NR | Yes | NR | NR | Yes |
| Dosage per injection (mg) + vehicle† | 25/2.5 mL saline | 32/2.5 mL saline | 20/2.0 mL saline | 20/2.0 mL saline | 25/2.5 mL saline | 60/3.0 mL saline | 20/2.0 mL saline | 25/2.5 mL saline |
| Cross-linked | No | Yes | No | No | No | Yes | NR | NR |
| NR=not reported | ||||||||
| * Given as 3 courses every 3 months of 3 weekly injections | ||||||||
| † Volume of saline placebo for each study equal to volume of hyaluronic acid injection plus saline vehicle used for that study | ||||||||
FIGURE 1
Hyaluronic acid vs control: 95% confidence intervals
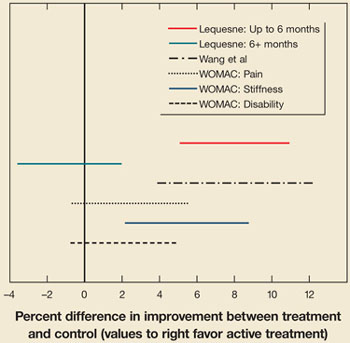
Confidence intervals that cross the 0-value represent a nonsignificant difference between active treatment and control. Also included is a result from the Wang et al meta-analysis15 for comparison.
TABLE 3
Mean improvements: treatment vs. control
| BASELINE | POST-TREATMENT | |||
|---|---|---|---|---|
| HA | PLACEBO | HA | PLACEBO | |
| LEQUESNE | 12.7 (3.0) | 12.44 (2.7) | 8.7 (4.4) | 8.91 (4.4) |
| % Lequesne* | 53.0 (12.8) | 51.83 (11.2) | 36.3 (18.5) | 37.1 (18.1) |
| WOMAC | ||||
| Pain* | 40.5 (17.0) | 43.9 (19.0) | 26.8 (18.3) | 30.9 (21.6) |
| Stiffness* | 47.0 (17.6) | 50.9 (21.1) | 33.0 (21.4) | 42.8 (24.0) |
| Disability* | 42.5 (18.6) | 46.8 (22.2) | 27.9 (19.0) | 33.3 (21.8) |
| The mean (standard deviation) change among included studies in outcomes scores between baseline and post-treatment at the final collection point for hyaluronic acid and placebo. An increase in outcome score represents improvement. | ||||
| * Normalized to a maximal score of 100 possible points | ||||
FIGURE 2
Comparing effect sizes of hyaluronic acid therapy and saline placebo
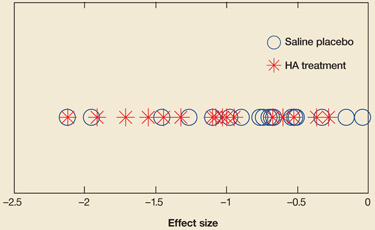
Across studies, effect sizes were similar for hyaluronic acid therapy and placebo.
Discussion: Benefits are limited
Based on this meta-analysis, we cannot conclude that hyaluronic acid performs better than saline placebo for a reduction of pain or disability on the WOMAC. Some indication may be warranted for reduction in stiffness. It is notable that hyaluronic acid injection and saline placebo groups both experienced an improvement in pain, stiffness, and disability scores on the WOMAC.
We also cannot conclude that hyaluronic acid enhances functionality as evaluated on the Lequesne Index past 6 months post-treatment. In 2 studies,7,19 patients with placebo actually showed reduced disability compared with patients in the hyaluronic acid group. While a short-term improvement in functionality was observed in other studies, this effect was not seen in follow-up reports greater than 6 months.
Comparisons with other meta-analyses
A recently published meta-analysis by Modawal et al20 also pooled data to compare hyaluronic acid treatment to saline placebo. That meta-analysis was similar to ours in that it had relatively small sample size (n=11) and examined self-reported patient outcomes as the item of interest. The difference between this meta-analysis and ours is that the length of the evaluation periods for the other analysis was fairly short; the longest follow-up was 26 weeks. Our study examined the pooled effects of hyaluronic acid carried out to at least 24 weeks and up to 52 weeks. Their results for the short-term outcomes demonstrated significant decrease in pain in the active treatment group; however, these results diminished considerably when controlled for study quality.