Statistical analysis
The primary analysis included a modified intent-to-treat population consisting of all randomized subjects who had at least 1 post-randomization observation. Missing observations were replaced with the prior observation carried forward. In addition, subjects not given the randomized treatment were analyzed as treated.
For the 7-item BPI interference subscale, missing values were replaced with the average of the non-missing completed items to compute a sum score, provided only 1 response was missing. If more than 1 response was missing, the subscale was defined as incomplete. If a subject failed to complete a form after randomization, he was considered to not have any post-randomization observations for that form and was excluded from the modified intent-to-treat population for that analysis.
The null hypothesis being tested in this pilot study is that there is no difference between treatments. The level for declaring statistical significance was a 2-sided P-value (P<.05). Efficacy endpoints were analyzed using paired t-tests, while global assessments of treatment satisfaction were analyzed using nonparametric methods. Continuous variables were tested by analysis of covariance (ANCOVA) with treatment group as the between-subject factor and baseline as the covariable. For continuous variables (ordinal variables with 5 or more values), a repeated measures ANCOVA was performed with treatment as the between-subject factor and visit and its interaction with treatment as within-subject factors. Ordinal variables with less than 5 values were evaluated using the Wilcoxon rank sum test.
All patients who received study medication were included in the safety analysis. Adverse events were classified according to MedDRA and the incidence of treatment-emergent events was summarized.
Results
Forty patients (20 per group) were enrolled in the study and assigned to receive either daily applications of the lidocaine patch 5% or a single lidocaine/corticosteroid injection. Baseline characteristics of patients were similar between groups (TABLE 1). The mean age of the predominantly female (70%) population was 48 years. All patients had mild or moderate CTS at baseline as determined by Global Clinical Impression of Severity of CTS. Although some patients had previously been treated for CTS, none had undergone carpal tunnel release surgery.
Five patients randomized to the lidocaine patch 5% group did not complete the trial due to adverse events (3 patients), being out of town (1 patient), and becoming lost to follow-up (1 patient). Three patients randomized to the injection group did not complete the study because of rejection of injection (1 patient), becoming lost to follow up (1 patient), and inclement weather (1 patient). Of the 8 patients who did not complete the study, 4 patients (3 in the patch group and 1 in the injection group), had at least 1 observation after randomization and were included in the intent-to-treat population.
Patients used an average of 1 patch per day. Use of concomitant analgesics was similar between groups.
FIGURE 1 shows the mean changes in pain intensity scores, including average pain, pain right now, least pain, and worst pain, from baseline to Week 4. No statistically significant between-group differences were observed. Both groups experienced significant improvements in average pain intensity. Mean changes in average pain scores were –2.2 with the patch (P=.0009) and –2.1 with the injection (P<.0001). More than 60% of patients in both groups experienced a clinically meaningful (≥30% reduction) improvement in average daily pain intensity. Patients in both groups also reported significant changes (P<.05) in worst pain (patch, –2.4; injection, –2.2), least pain (patch, –1.6; injection, –1.1), and pain “right now” (patch, –2.1; injection, –1.3).
Composite interference scores, which are measures of how much patients’ pain interfered with 7 domains of QOL (general activity, mood, waking ability, normal work, relations with other people, sleep, and enjoyment of life), also significantly improved in both treatment groups (patch, –13.9; injection, –16.7; P<.001 vs baseline for both groups), as shown in FIGURE 2. Eighty percent of patients in the patch group and 59% of patients in the injection group reported being “satisfied” or “very satisfied” with treatment, while investigators reported improvement in 88% of patients on the patch and in 74% of those who received the injection (TABLE 2).
Three patients in each group (15%) reported treatment-related adverse events, all of which were mild in severity. Adverse events reported in the lidocaine patch 5% group included rash (n=1), itching (n=1), and a burning sensation (n=1). One patient in the lidocaine patch 5% group who experienced a skin rash discontinued the study due to this adverse effect. Two patients discontinued the study due to dizziness and palpitations (n=1) and nausea, diarrhea, and vomiting (n=1), adverse events considered to be unrelated to treatment. Three patients who received the injection reported hand numbness (n=1), injection site pain (n=1), and tingling in hands (n=1). No systemic treatment-related adverse events were observed with the lidocaine patch 5%.
FIGURE 1
Mean pain intensity scores
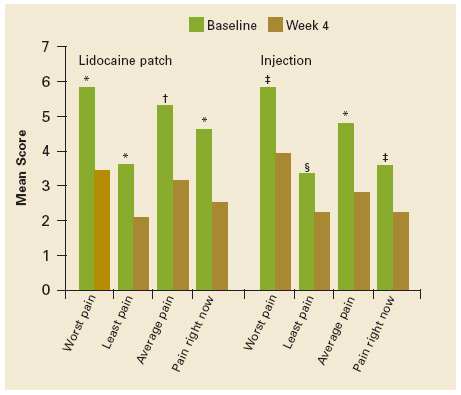
Mean pain intensity scores (worst pain, least pain, average pain, pain right now) as measured on the Brief Pain Inventory at baseline and at Week 4. *P<.0001. †P<.001. ‡P<.01. §P<.05. No significant between-group differences were observed.
FIGURE 2
Mean composite scores of pain interference with QOL
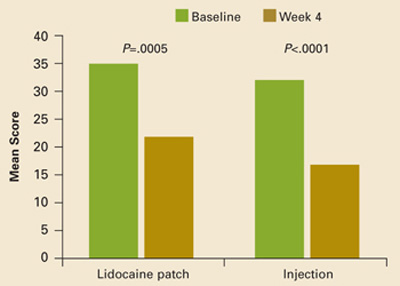
Mean composite scores of pain interference with quality of life at baseline and at Week 4.