Data extraction and analysis
We assessed study quality with the QUADAS tool.7 Two reviewers assessed study quality and extracted data independently. We calculated the pooled sensitivity and specificity using Metatest (New England Medical Center, Boston, Mass) and the pooled positive and negative likelihood ratios using the Der-Simonian and Laird random effects model of Revman 4.29 (Cochrane Collaboration), which also tests for heterogeneity.
Results
Search results and selection
The search strategy identified 110 citations. Six studies were selected for further assessment for inclusion; 3 met the inclusion criteria and covered 2385 patients (FIGURE). All 3 studies included patients older than 65 years enrolled from general practice clinics, and in each study the pulse was taken by a nurse in the clinic. TABLE 1 summarizes the methodological quality, patient characteristics, and results of the 3 studies.
FIGURE
Studies included in this review
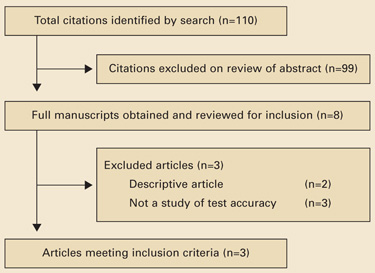
TABLE 1
Detecting atrial fibrillation by pulse palpation: Pertinent studies
| STUDY QUALITY CHARACTERISTICS | MORGAN AND MANT8 | SOMERVILLE ET AL10 | SUDLOW ET AL9 |
| Random or consecutive sampling | Yes | No* | Yes |
| Independent assessment | Yes | Yes | Not stated |
| Blind assessment | Yes | Yes | Not stated |
| Verification by ECG | 100% | 100% | 100% |
| Description of index and reference test | Good | Poor | Poor |
| STUDY CHARACTERISTICS | |||
| Number of patients | 1099 | 86 | 1200 |
| Age | 74.3 (65–100) | 65+ | 65+ |
| Setting | 4 GP practices | Single GP practice | Patients from 9 general practices |
| Location | Southampton, UK | Stoke-on Trent, UK | Southern Northumberland, UK |
| Index test | Radial pulse palpated by a nurse for a minimum of 20 seconds† | Pulse palpated by an experienced nurse.§ Time not specified | Pulse palpated by a nurse. Time not specified |
| Reference test | ECG read by cardiologist | 12-lead ECG read by cardiologist | Limb-lead ECG |
| RESULTS | |||
| Prevalence (%) | 6.1 | 30 | 4.6‡ |
| Sensitivity (%; 95% CI) | 91 (81–96) | 100 (87–100) | 95 (85–98)‡ |
| Specificity (%; 95% CI) | 74 (72–77) | 77 (65–86) | 70 (67–73)‡ |
| Positive likelihood ratio (95% CI) | 3.5 (3.1–4.0) | 4.1 (2.6–6.5) | 3.1 (2.8–3.5) |
| Negative likelihood ratio (95% CI) | 0.12 (0.06–0.27) | 0.024 (0.002–0.38) | 0.09 (0.03–0.25) |
| * Case-control study. | |||
| † Designated as regular or irregular. Irregular pulses were categorized into occasional ectopic, frequent ectopics, or continuously irregular. Patients with any irregularity were considered to have a positive index test. | |||
| § Experienced in community and emergency nursing, as well as taking and interpreting ECGs. | |||
| ‡ Data provided by the authors. | |||
Methodological quality of included studies
The study by Morgan and Mant8 fulfilled all the major quality criteria. The studies by Sudlow et al9 and Somerville et al10 were of moderate quality. Sudlow et al did not report an overall sensitivity or specificity, nor the data for calculating these test attributes. The authors kindly provided us the data from their study to calculate the 2×2 table of results.
Prevalence of atrial fibrillation
We calculated the pooled prevalence of atrial fibrillation, excluding data from Somerville et al, as it was a case-control study. The pooled prevalence of atrial fibrillation in the 2 remaining studies was 5.3%, consistent with previous estimates of atrial fibrillation in general practice settings and data from the Framingham cohort.1,11
Accuracy of pulse palpation for detecting atrial fibrillation
The sensitivities in the 3 studies ranged from 91% to 100% and the specificities ranged from 70% to 77%. The pooled sensitivity was 94% (95% CI, 84%–97%) and the pooled specificity was 72% (95% CI, 69%–75%). Low specificity reflects the pervasiveness of other pulse abnormalities, resulting in false-positive test results for atrial fibrillation (TABLE 2).
The pooled positive likelihood ratio was 3.4 (95% CI, 3.2–3.7), showing that pulse palpation was only moderately helpful for ruling in atrial fibrillation. The pooled negative likelihood ratio was 0.11 (95% CI, 0.06–0.20), showing that when no pulse irregularity is detected, the diagnosis of atrial fibrillation can be excluded with reasonable confidence. The chisquare test for heterogeneity for the positive likelihood ratio was 3.87 (df=2; P=.14) and for the negative likelihood ratio was 1.49 (df=2; P=.49), indicating consistency of results between the studies.
TABLE 2
Causes of an irregular pulse
| Sinus arrhythmia |
| Atrial extrasystoles |
| Ventricular extrasystoles |
| Atrial fibrillation |
| Atrial tachycardia with variable response |
| Second-degree heart block |
| Source: Munro and Campbell, eds, MacLeod’s Clinical Examination, 2000.14 |
Discussion
Though an irregularly irregular pulse is a classical clinical sign, we were able to find only 3 published studies evaluating its accuracy in the detection of atrial fibrillation. Study results showed a relatively high sensitivity but poor specificity.
Each study compared the diagnostic accuracy of pulse palpation by nurses in general practice against the reference test, ECG diagnosis by a cardiologist. No information was available on interobserver reliability of pulse palpation.
Working toward reliable screening. Atrial fibrillation is common, serious, and treatable. The initial clinical manifestation of undetected atrial fibrillation might be a dire consequence of the arrhythmia, such as stroke. If a suitably accurate diagnostic test or series of tests were available, it might be effective and cost-effective to screen for the disorder.12 A randomized controlled trial to evaluate such screening (including a comparison of diagnostic strategies) is currently underway.13