Statistical analysis
The outcome was knee pain reported by patients on activity or at rest, measured using a VAS of 100 mm. The results of the clinical trials were recorded as the mean differences of change from baseline between the treatment and placebo groups. If not reported in the publication or provided by the authors, standard error was imputed using the method of Follman et al.20 We used the method of Chalmers for measuring the quality of randomized trials, with 2 of the authors rating the studies independently.21
This clinical trial grading system takes into account the following aspects of the trial to determine a quality score: evaluation of recruitment of subjects, rejection log, therapeutic regimen definition, randomization, blinding, prior estimates of numbers, testing compliance, statistical inference, use of appropriate statistical analysis, handling of withdrawal and side effects, dates of starting and ending, timing and tabulation of events. Because 4 of the trials had poor quality scores, an additional analysis excluding these 4 was performed. The DerSimonian and Laird random-effects model was used to obtain the summary estimates.22,23
An important element of meta-analysis is exploration of the heterogeneity of the outcomes and the possible causes of heterogeneity if it exists. Heterogeneity is the degree to which results vary from study to study. If a test for heterogeneity is statistically significant, there is significant variability among the treatment effects observed in the trials. We explored heterogeneity using Galbraith plots (FIGURE 1).24 In the absence of heterogeneity, all points fall within the confidence limits. Because we did find heterogeneity among these trials, we developed random-effect regression models to explore 3 possible sources of heterogeneity in the efficacy of hyaluronic acid; pain (measured at rest or on activity), the form used (hyaluronan or hylan G-F20), and the quality of the study method (good or poor).
Publication bias was assessed by the Egger et al regression asymmetry test.25 Analyses were performed using the meta-analytic software program of STATA, Inc (College Station, Tex; available at www.stata.com).
FIGURE 1
Evidence of heterogeneity for the studies evaluated at outcome measurement time (week 1)
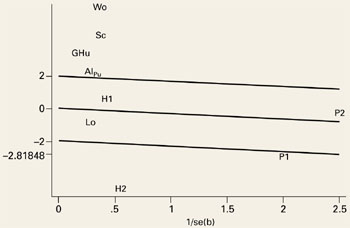
This Galbraith plot shows standardized effects (b/se=mean difference/standard error) as a function of study precision (1/standard error), slope of the line shows average effect over all the studies with upper and lower lines denoting an approximate 95% confidence interval for this common effect. Under the hypothesis of study heterogeneity, the common slope intersect zero at 1/se=0, and 95% of all study estimates (authors initials) will fall within the confidence interval of the regression line. Gr: Grecomoro; Pu: Puhl; H1: Henderson 1; H2: Henderson 2; Sc: Scale; Lo: Lohmander; Al: Altman; Wo: Wobig; Hu: Huskisson; P1: Petrella 1; P2: Petrella 2.
Results
The 11 randomized, placebo-controlled, double-blinded clinical trials that met our inclusion criteria are summarized in TABLE 1. Nine trials used hyaluronic acid, hyaluronan, or hyaluronate (all types will be referred to as hyaluronan in the text), and 2 studies used hylan GF-20. Only 3 hyaluronan trials have published outcome data at 15 to 22 weeks follow-up. Treatment was administered to patients as 3 to 5 weekly injections, with the exception of the Grecomoro study in which treatment was administered twice weekly. The control group in 10 trials received intra-articular saline injections as placebo. In the Puhl study the investigators added 0.25 mg of hyaluronic acid to the saline injections to impart viscosity to the solution. The mean age of the subjects for the 11 trials was 63 years.
Eight trials received support from pharmaceutical companies and 3 (the 2 by Henderson and the Grecomoro study) did not disclose any pharmaceutical support. One study was conducted in the United States, 3 in the UK, 3 in Germany, 1 in Sweden, 1 in Italy, and 2 in Canada. Five of the studies had scores over a cutoff quality score of >0.75,12,13,15,16,19 indicating they were good-quality randomized controlled trials; the remaining 4 had scores below 0.75.11,14,16,17
The outcomes of the 11 trials are summarized in TABLE 2. Patients’ pain ratings in both the active treatment and placebo groups improved in all the trials. Mean difference between improvements in treatment and placebo groups are shown in FIGURES 2A-2D for pain assessed at weeks 1, 5 to 7, 8 to 12 and 15 to 22, respectively. In each figure, we show the summary estimate of effect size with all the trials included and after excluding the 4 trials considered of poor quality, shown as “good quality studies.”