TABLE 2
Factor analysis solutions
| Eigenvalues by number of factors in solution | ||||
|---|---|---|---|---|
| Iteration | 1 | 2 | 3 | 4 |
| 1 | 2.88 | 1.67 | 1.44 | 1.23 |
| 2 | 1.95 | 1.20 | 0.809 | 0.387 |
| 3 | 3.35 | 2.31 | 1.60 | 0.821 |
TABLE 3
Scale interpretations
| Scale | Interpretation | Questions (on iteration 3)* |
|---|---|---|
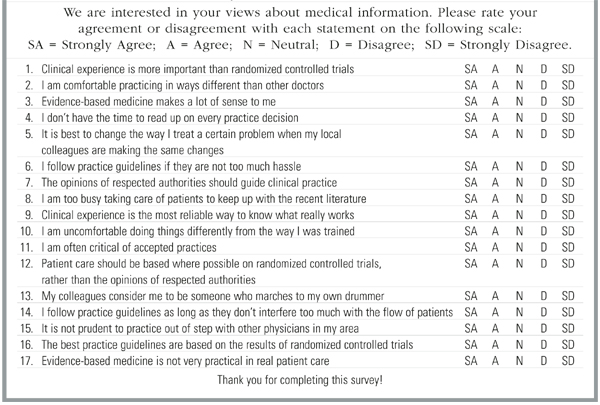
| 1 | Evidence–experience | 1, 3, 9, 12, 16, 17 |
| 2 | Nonconformity | 2, 5, 7, 11, 13, 15 |
| 3 | Practicality | 4, 6, 8, 10, 14 |
| *See Figure. | ||
TABLE 4
Scale internal consistencies
| Cronbach α at each iteration | |||
|---|---|---|---|
| Iteration | Evidence-experience | Nonconformity | Practicality |
| 1 | 0.63 | 0.61 | 0.54 |
| 2 | 0.70 | 0.59 | 0.48 |
| 3 | 0.79 | 0.74 | 0.68 |
TABLE 5
Scale scores by physician type, second iteration
| Physician type | Evidence vs experience (range, 5–25) | Nonconformity (range, 4–20) | Practicality (range, 4–20) |
|---|---|---|---|
| Seekers | Extreme evidence end: ≥20 | High: >12 | Not high: ≤14 |
| Receptives | Toward evidence end: ≥15 | Moderate: ≤12 | Not high: ≤14 |
| Traditionalists | Toward experience end: <15 | Variable | Not high: ≤14 |
| Pragmatists | Variable | Variable | High: >14 |
TABLE 6
Scale scores by physician type, third iteration (depicted in the Figure)
| Physician type | Evidence vs experience (range, 6–30) | Nonconformity (range, 6–30) | Practicality (range, 5–25) |
|---|---|---|---|
| Seekers | Extreme evidence end: ≥22 | High: >18 | Not high: ≤14 |
| Receptives | Toward evidence end: ≥18 | Moderate: ≤18 | Not high: ≤14 |
| Traditionalists | Toward experience end: <18 | Variable | Not high: ≤14 |
| Pragmatists | Variable | Variable | High: >14 |
FIGURE Psychometric Instrument
Results
For the first, second, and third iterations, we received 106, 1120, and 61 instruments respectively that were completed in usable form. At every stage of the instrument’s development, factor analysis showed that a 3-factor model fit best. The eigenvalues declined rapidly when there were more than 3 factors (Table 2), showing that additional factors would not improve the solution.
Orthogonal rotation and interpretation of the questions making up each factor produced 3 psychologically meaningful scales (Table 3) corresponding closely to our theoretical model; the same 3 scales emerged at each iteration. The scales are named similarly to the theory above: evidence–experience, practicality, and nonconformity. The Cronbach α for each scale at each iteration is presented in Table 4.
Using the above-described classification scheme (with specific cutoffs detailed in Tables 5 and 6), the 1181 physicians who completed the instrument in the second and third iterations were classified as follows: 2.5% seekers; 57.0% receptives; 12.6% traditionalists; and 27.9% pragmatists. Different cutoff values would yield somewhat different percentages, but seekers are very few using any reasonable value.
Discussion
These results are consistent with the theoretical construct of 3 factors underlying our physician classification scheme and demonstrate that those factors can be measured on scales with reasonable internal consistency. The data are consistent with the theory on which the instrument was developed. Not all possible combinations of the 3 factors exist, which is consistent with the 4-types theory depicted in Table 1. For example, there should be no physicians who are strongly evidence-based and strongly conformist, and that combination does not occur. However, there are physicians who are strongly evidence-based and strongly nonconformist (the seekers). Few physicians selected either extreme for any factor, but with the exception of nonconformity, a broad range existed across all of the factors.
These findings show that physicians differ in their attitudes toward new information about the effectiveness or appropriateness of clinical strategies, and that those differences are measurable and quantifiable. Quantifying those differences was a major step forward in testing our theoretical framework for selecting effective practice change strategies.
The next step is to demonstrate external validity by showing that differences in physician behavior are consistent with demonstrable differences in attitudes. Such a study is underway at this writing. A trial of practice change interventions guided by the categorization scheme should be carried out subsequently.
The categories we propose do not reflect bimodal distributions of attributes; physicians are distributed relatively uniformly all along the 3 scales. The categories are useful descriptors, not absolute pigeonholes.
The results suggest to us that there is fertile ground for applied psychometrics and cognitive science research related to changing clinical practices. Such work may help illuminate the murky results of practice change intervention and guideline implementation studies to date. Further cognitive research about our own theoretical framework is likely to identify factors and complexities that we have not yet addressed.
· Acknowledgments ·
The authors thank Mark Ebell, MD, MS for his assistance in revising the instrument; Judith Zemencuk and Bonnie Boots-Miller of the Ann Arbor Veterans Administration Health Services Research and Development offices for their assistance in distributing the instrument to and collecting data from Veterans Administration physicians; Janice Klos for her help in gathering data from Michigan Academy of Family Practice member physicians; Van Harrison, PhD and his staff for their help in enlisting the participation of physicians at Michigan CME events; and of course, the Veterans Administration, Michigan Academy of Family Practice, and Michigan physicians who graciously completed instruments for this project.