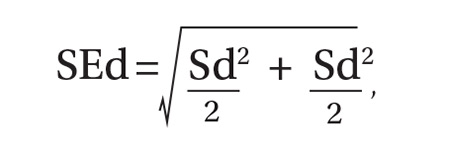
As per protocol, we obtained 4 BP readings on each patient and calculated the difference between the average systolic and diastolic BP values from the 2 positions. The standard error of the mean of this difference was determined using the equation, where Sd is the standard deviation of the aneroid sphygmomanometer and observer.12 A one-sided, 95% confidence upper bound for the standard error of the difference is 1.65 × SEd. We compared patient-specific differences against this upper bound to identify significant systolic and diastolic BP changes due to positioning. If the patient’s BP difference exceeded the upper bound, it was attributed to the positional change and not to variation inherent to the sphygmomanometer and observer.
As an example, consider a patient whose average systolic BP readings from the examination-table and standard positions, respectively, were 128 mm Hg and 120 mm Hg. Assuming an SEd of 3.55 and an upper bound of 5.86, the observed 8 mm Hg difference in average systolic BPs would be considered significant. The amount of random variation from the sphygmomanometer and observer would not be expected to exceed 5.86 mm Hg.
In accordance with accepted standards, prehypertension was defined as a BP between 120-139/80-89 mm Hg, and hypertension was defined as a BP ≥140/90 mm Hg.4 BP below 120/80 mm Hg was considered normal. We calculated each patient’s average systolic and diastolic BP values in the 2 positions and thereby classified the individual as normotensive, prehypertensive, or hypertensive. We regarded as misclassified any patient whose BP showed significant lowering between the examination-table and standard positions resulting in a change of classification from prehypertensive or hypertensive to normotensive. For example, a patient with an examination-table position average reading of 126/85 mm Hg and a standard position average reading of 118/78 mm Hg would have been misclassified as prehypertensive.
We reviewed charts and gathered data, including subject age, sex, obesity (defined as a body mass index of ≥30 kg/m2), and history of diabetes, hypertension, or smoking. Other than age, all data were binary. We performed logistic regression analysis using the Excel Add-in Real Statistics Resource Pack software (Release 4.3)13 to determine if these factors could predict significant lowering of BP due to positional change.
Our associated observational study. We also conducted a separate observational study of 25 regional primary care offices to evaluate compliance with the AHA guidelines for measuring BP. The office nurses taking measurements were not informed of the study’s purpose to prevent deviation from their common practice.
Data on 9 guideline criteria were collected to assess supervision of patients before and during measurements, including having the patient sit in a chair in quiet and comfortable surroundings with arms and back supported and feet on the ground. We also noted the type of BP measuring device used. Additionally, observers assessed the technique of the individuals using a manual device, including cuff placement and deflation rate. The observations were conducted during a clinic visit by a medical student knowledgeable in the AHA guidelines for measuring BP by automated oscillometric or aneroid sphygmomanometric devices. We conducted the study over a 2-week period in the second quarter of 2016.
RESULTS
Power analysis performed prior to the study showed that a minimum of 26 patients would be needed to predict a 2 mm Hg difference between BPs obtained in the 2 positions. Of the 204 patients used in the logistic regression analysis, 78 were men and 126 were women. Ages ranged from 18 to 101 years, yielding a mean of 54. One-hundred sixteen had previously received a diagnosis of hypertension, 39 had diabetes, 92 were obese, 22 were current smokers, and 68 were former smokers.
TABLE 1 shows the means and ranges of systolic and diastolic BP for both study positions. With this study population, mean BP recorded in the examination-table position decreased in the standard position by 2.1 and 2.2 mm Hg for systolic and diastolic BP, respectively (P<.001).

Significant BP lowering—as defined by a one-sided 95% confidence upper bound for the standard error of differences between study positions—was determined to be 5.86 and 6.22 mm Hg for systolic and diastolic pressures, respectively. Significant lowering of BP and misclassification due to positioning are summarized in TABLE 2. Significant lowering of mean systolic or diastolic BP with positional change from table to chair occurred in 62 subjects (30.4%). Misclassification of prehypertension occurred in 7.4% of subjects, and misclassification of hypertension occurred in 5.9%.

Logistic regression using patient age, sex, obesity, and history of diabetes, hypertension, and smoking as independent factors did not predict significant BP lowering with positional change.
Our observational study revealed that proper positioning in a chair was followed in only 10 of the 25 offices. In the remaining offices, patients were seated on the examination table. A 5-minute rest period before measuring BP was allowed in only 10 of the 25 offices. An automated oscillometric device was used in only 2 of the 25 offices.